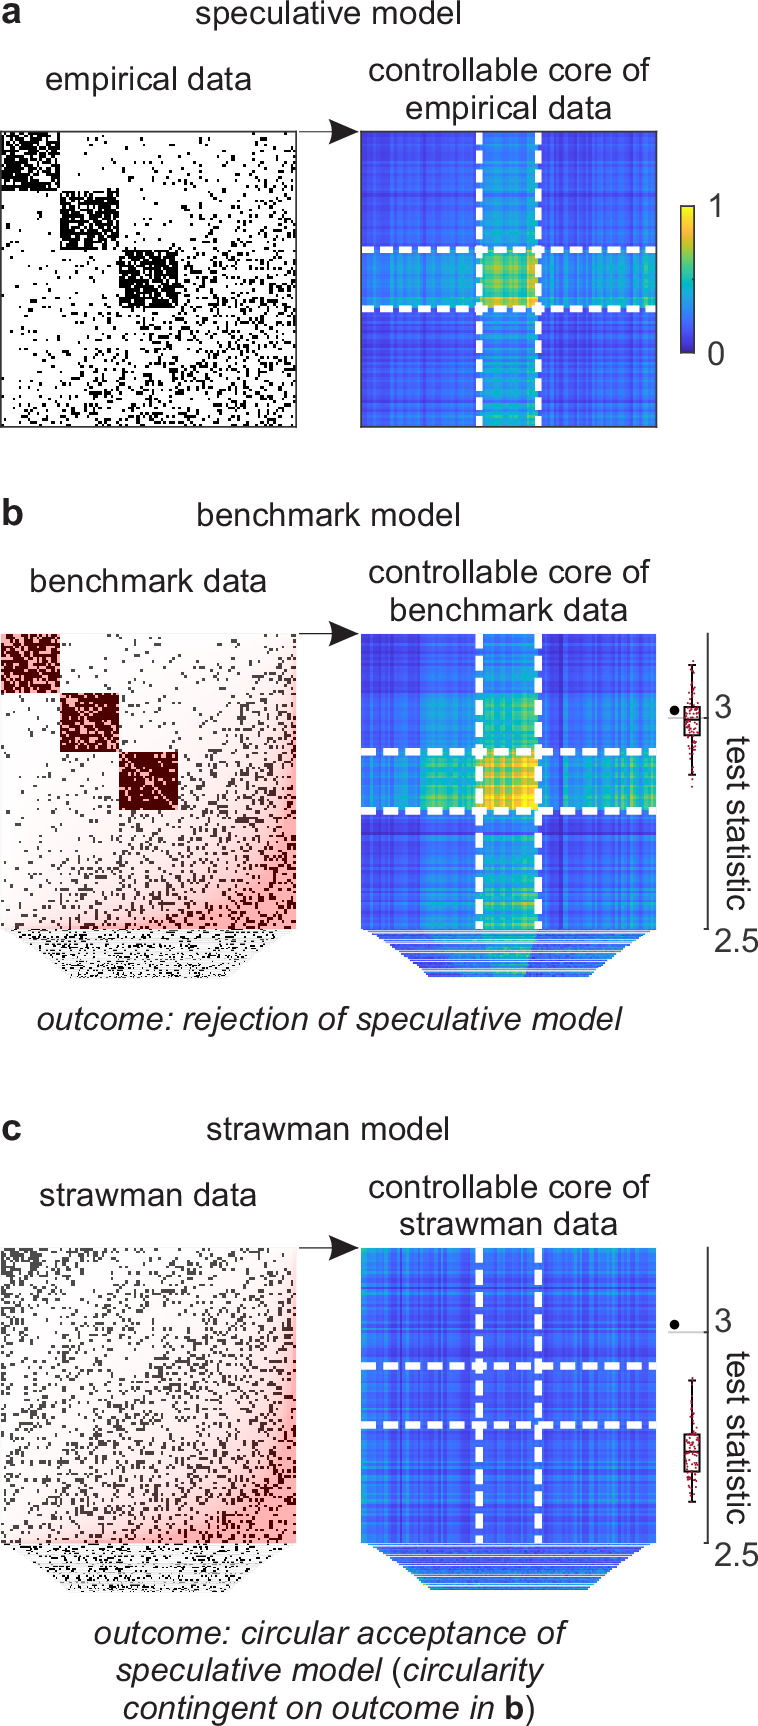
Figure 4. Example analysis.

(a) Left: A toy cortical network. Right: A matrix that reflects the controllability of specific network states (a one-rank approximation of the controllability Gramian [Brunton and Kutz, 2019]). Dashed lines delineate the controllable core. The test statistic is the logarithm of the sum of all matrix elements within this core. (b) Left: Data samples from a benchmark-model distribution. The benchmark model includes empirical network modules and node connectivity (red overlays). Right: Controllable cores in benchmark-model data. Rightmost: Empirical (large black dot) and benchmark test statistics (small red dots). (c) Left: Data samples from a strawman model distribution. The strawman model includes node connectivity but not empirical network modules (red overlay). Right: Controllable cores in strawman-model data. Rightmost: Empirical test statistic (large black dot) and strawman test statistics (small red dots).
