. 2023 Nov 28;12:RP88183. doi: 10.7554/eLife.88183

Figure 1. Changes in proportions of major cell types during ligature-induced periodontitis development in mice.

(A) Mouse maxillary second molar (M2) has multi-roots and supported by alveolar bone (Bone), periodontal ligament (PDL), and gingiva connective tissue (gCT). The oral barrier immunity is not constitutively activated as evidenced by the lack of CD45+ immune cells. Picrosirius red (PSR)-stained collagen fibers connected the root surface and alveolar bone in the PDL and organized as dense parallel bundles in gCT. (B) One day (day 1) after a ligature (5.0 silk suture) was placed around M2, the cervical PDL and gCT demonstrated a localized connective tissue degradation (*), where CD45+ immune cells clustered (arrows). PSR-stained collagen architecture immediately under the ligature lost the thick collagen bundle structure (*). (C) Day 3 of ligature placement exhibited localized but increased CD45+ immune cell clustering adjacent to the collagen degradation area (*). (D) Day 7 of ligature placement, PDL, and gCT tissue degradation increased with inflammatory vascularization (Vas). CD45+ myeloid cells (arrowheads) were observed near the alveolar bone surface and CD45+ lymphocytes (arrows) infiltrated the gCT area. PSR staining lost the typical collagen pattern in gCT and PDL, and a remnant of degraded PDL collagen fiber (white bracket) was attached to the tooth surface. (E) Single-cell RNA sequencing (scRNA-seq) t-distributed stochastic neighbor embedding (t-SNE) projection plots showing the major cell types present within gingival tissue during periodontitis development on days 0, 1, 4, and 7. Colors indicate cell type as follows: green, epithelial cells; blue, fibroblasts; pink, endothelial cells; yellow, B cells; red, T cells; and purple, myeloid cells. (F) Proportion plots showing the relative amounts of each major cell type on days 0, 1, 4, and 7.

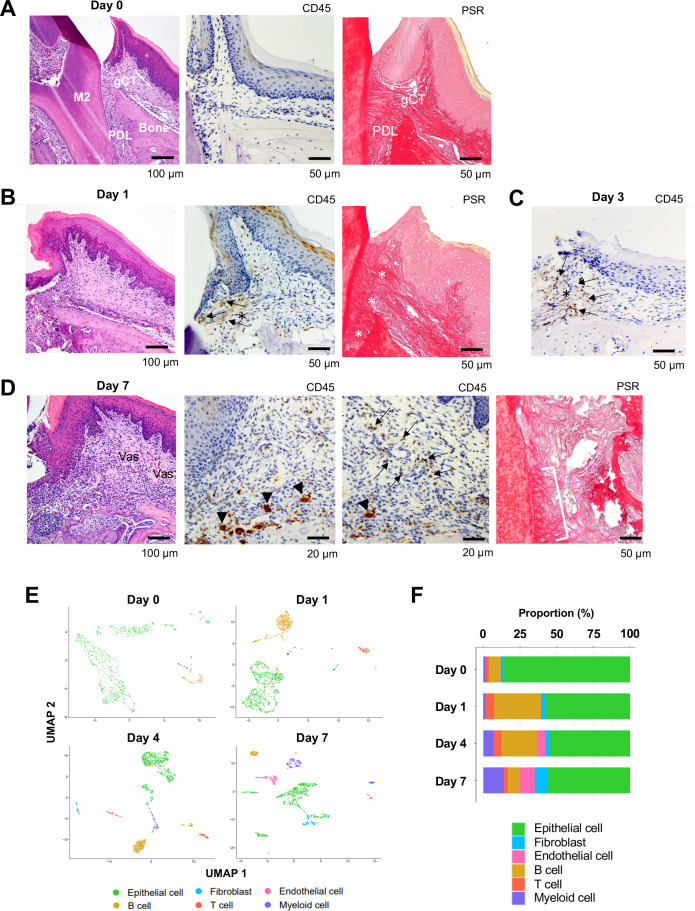
Figure 1.

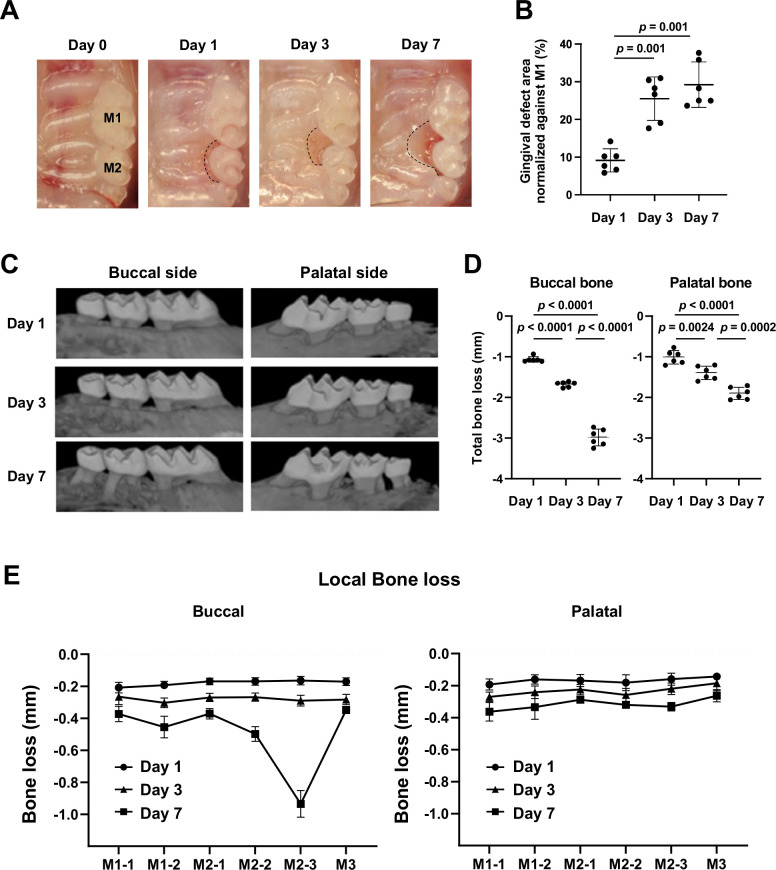
Figure 1—figure supplement 1. Gingival defect formation and alveolar bone loss in the ligature-induced periodontitis model in mice.

Figure 1—figure supplement 1.

(A) A ligature (5.0 silk suture) was placed around the maxillary second molar (M2) of wild-type (WT) mice. Representative intra-oral photographs of the maxilla on day 0, prior to ligature placement (healthy gingiva), and on days 1, 3, and 7 after ligature placement. (B) The gingival defect area was measured and normalized to the circumferential area of the maxillary first molar (M1) (n = 6). Gingival defects appeared on day 3. (C) Representative micro-computed tomography (microCT) images of the maxilla taken from the lateral view. (D) Alveolar bone loss was determined from the total distance between the cementoenamel junction (CEJ) and the alveolar bone crest (ABC) of the buccal or palatal bone at six sites in the ligated side (n = 6). Alveolar bone loss was apparent on day 7. (E) Alveolar bone loss was assessed at the mesiobuccal cusp (M1-1), distobuccal cusp (M1-2), and distal cusp (M1-3) of the first molar, the mesiobuccal cusp (M2-1) and distobuccal cusp (M2-2) of the second molar, and the buccal cusp (M3) of the third molar by measuring the distance from the CEJ to the ABC on the buccal or palatal side of the alveolar bone (n = 6). Significance was determined by one-way ANOVA, with Tukey’s multiple-comparison test. Data are presented as mean values ± standard deviation (SD); p<0.05 was considered significant.
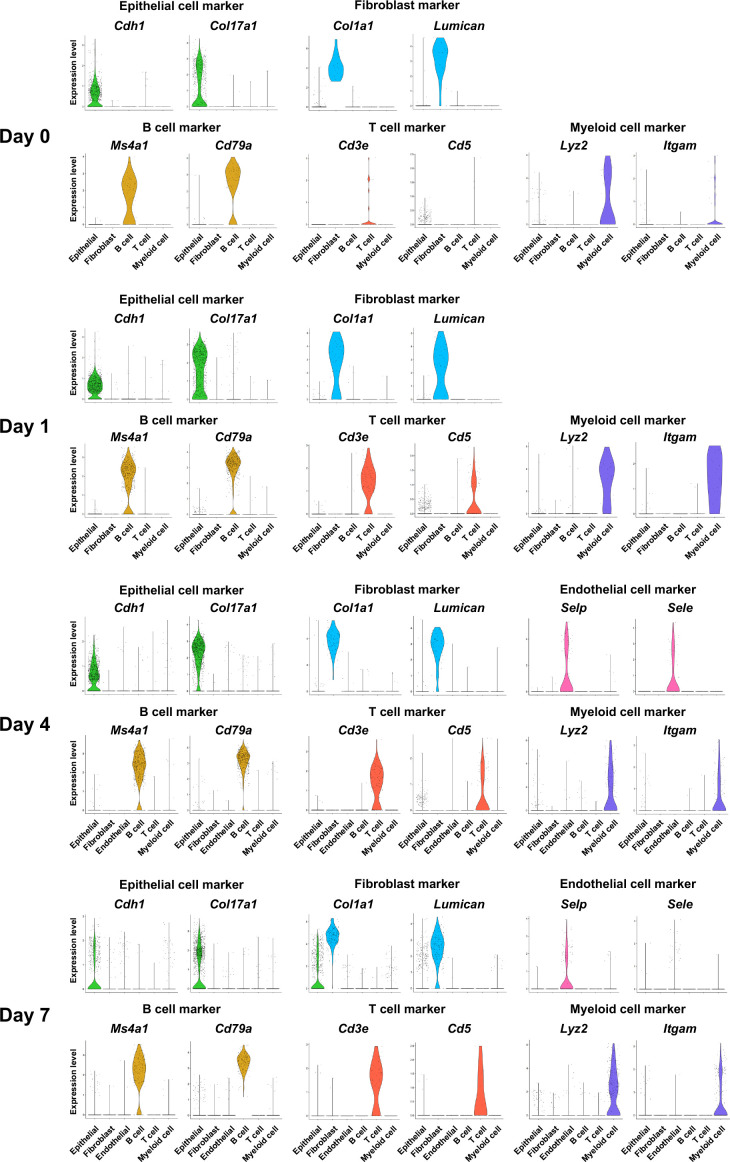
Figure 1—figure supplement 2. Identification of major cell types in mouse gingival tissue during periodontitis development by single-cell RNA sequencing (scRNA-seq).

Figure 1—figure supplement 2.

Violin plots showing expression levels of cell-type marker genes in each major cell type: epithelial cells, cadherin 1 (Cdh1) and type XVII collagen (Col17a1); fibroblasts, type I collagen (Col1a1) and lumican (Lum); endothelial cells, selectin P (Selp) and selectin E (Sele); B cells, membrane spanning 4 domains A1 (Ms4a1) and cluster of differentiation 79A (Cd79a); T cells, epsilon subunit of T cell receptor complex (Cd3e) and cluster of differentiation 5 (Cd5); and myeloid cells, lysozyme 2 (Lyz2) and integrin subunit alpha M (Itgam).