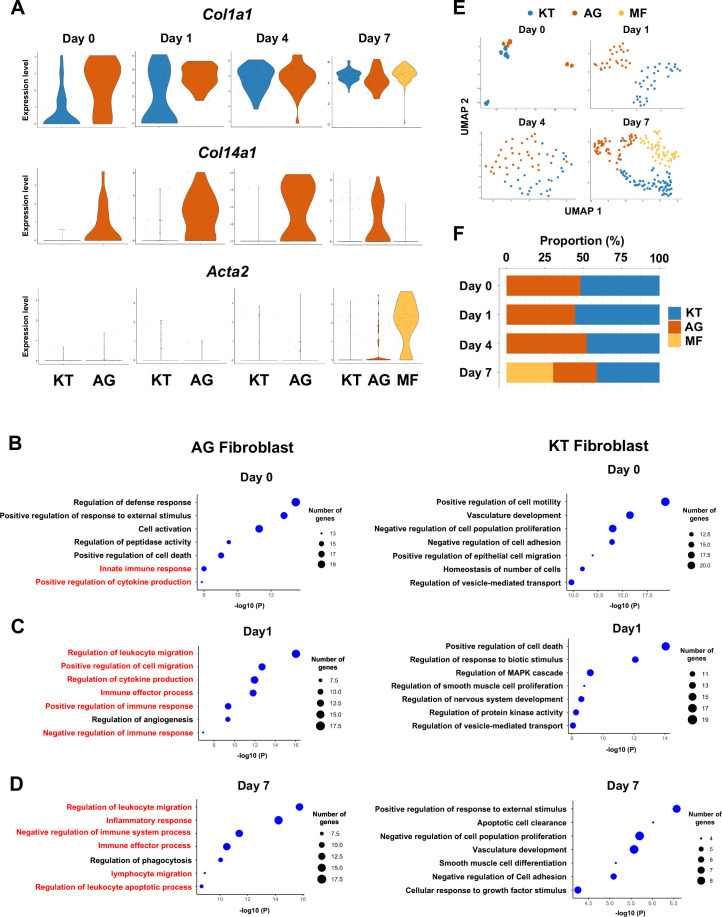
Figure 2. Fibroblasts activated to guide leukocyte migration (AG fibroblasts) are one of three fibroblast subpopulations in gingival tissue during periodontitis development.
(A) Violin plots showing gene expression levels of type I collagen (Col1a1), type XIV collagen (Col14a1), and smooth muscle aortic actin 2 (Acta2) in gingival fibroblast subpopulations during periodontitis development. AG, AG fibroblasts; KT, ‘keeping typical phenotype’ fibroblasts; MF, myofibroblasts. Gene Ontology (GO) enrichment analysis of the biological functions of AG fibroblasts and KT fibroblasts on day 0 without ligature placement (B) and on day 1 (C) and day 7 (D) after ligature placement. Gene clusters related to immune regulation (red) were identified in AG fibroblasts, and these clusters dominate after ligature placement. (E) t-distributed stochastic neighbor embedding (t-SNE) projection plots showing fibroblast subpopulations in gingival tissue during periodontitis development. Colors indicate cell type as follows: blue, KT fibroblasts; red, AG fibroblasts; and yellow, MFs. (F) Proportion plots showing the relative amounts of each fibroblast subpopulation on days 0, 1, 4, and 7.

