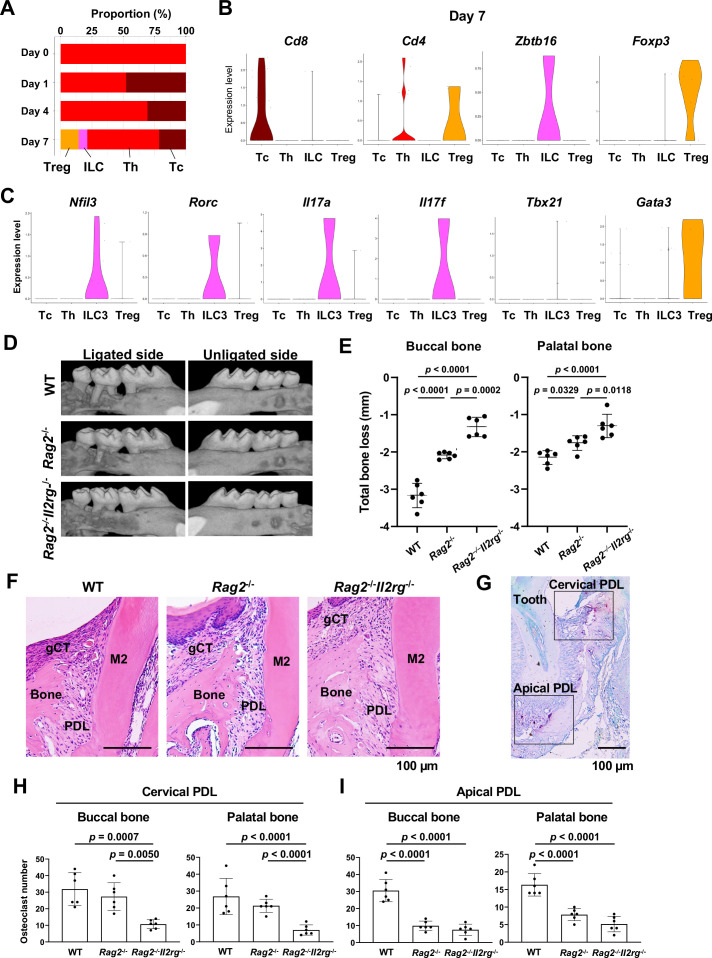
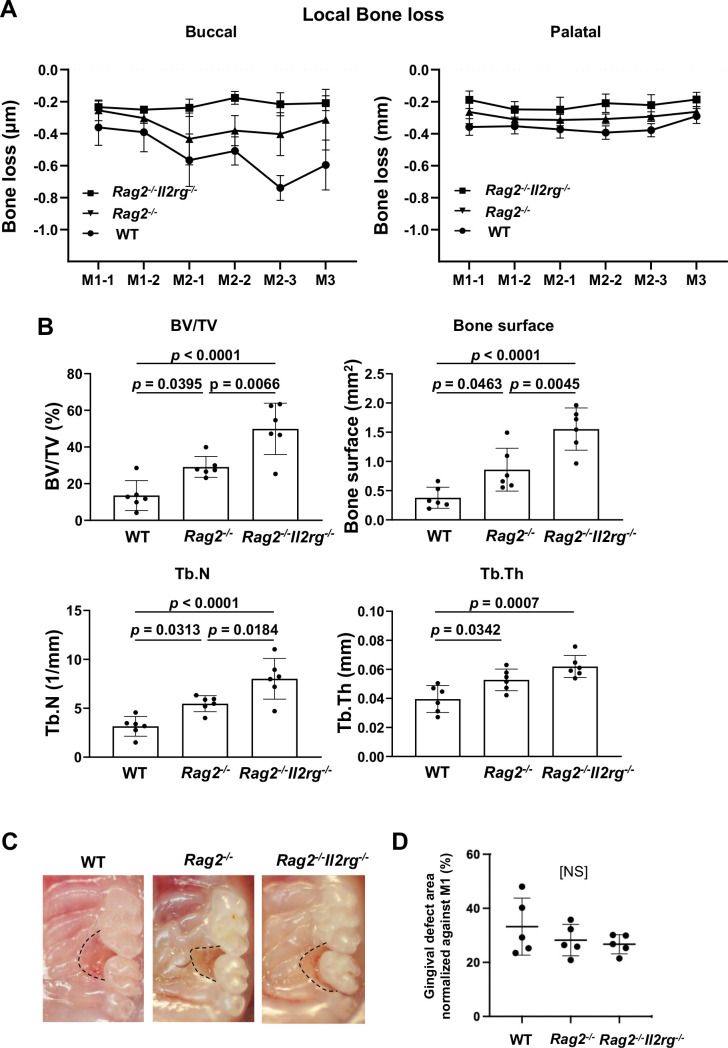
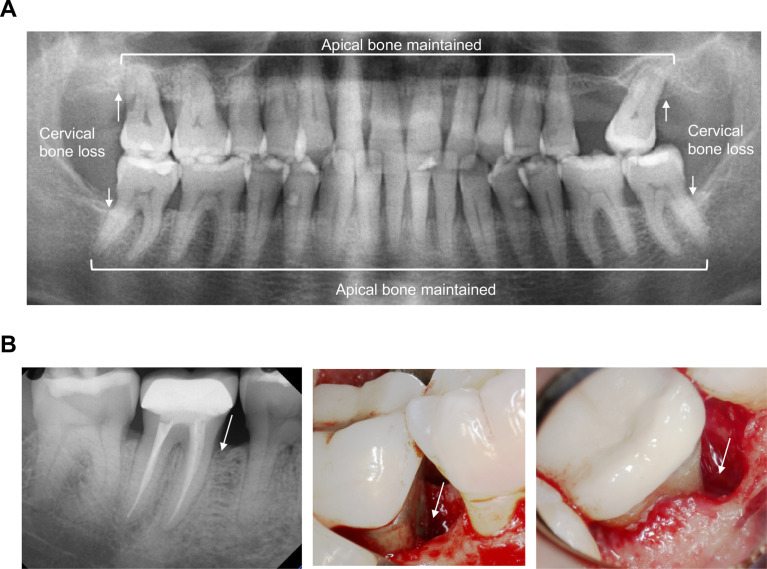
Figure 8. Type 3 innate lymphoid cells (ILC3s) are critical for cervical alveolar bone resorption in the ligature-induced periodontitis development.
(A) Proportion plots showing the relative amounts of T cell subpopulations in gingival tissue during periodontitis development. Treg, T regulatory cells; ILC, innate lymphoid cells; Th, T helper cells; Tc, cytotoxic T cells. (B) Violin plots showing expression levels of the T cell marker genes Cd8 (Tc), Cd4 (Th), Zbtb16 (ILC), and Foxp3 (Treg) on day 7 following ligature placement. (C) Violin plots showing expression levels of Nfil3, Rorγ, Il17a, Il17f, Tbx21, and Gata3 on day 7 following ligature placement. These gene signatures indicate that gingival ILCs primarily comprise ILC3s. (D) Representative micro-computed tomography (microCT) images of the maxilla taken from the lateral view for the ligated side and from the contralateral view for the unligated side. (E) Alveolar bone loss was determined from the total distance between the cementoenamel junction (CEJ) and the alveolar bone crest (ABC) of the buccal bone or palatal bone at six sites in the ligated side (n = 6). (F) HE staining of the periodontal tissue on day 7. gCT, gingival connective tissue; Bone, alveolar bone; PDL, periodontal ligament; scale bars, 100 µm. (G) Tartrate-resistant acid phosphatase (TRAP) staining of periodontal tissue from WT mice on day 7; scale bar, 100 µm. Total number of TRAP-positive cells in a 0.01 mm2 area of the buccal and palatal bone in the cervical PDL site (H) and apical PDL site (I) (n = 6). Significance was determined by ANOVA, with Tukey’s multiple-comparison test. Data are presented as mean values ± SD; p<0.05 was considered significant.


