

Abstract
INTRODUCTION:
Phase 2 trials are fundamental to the rational and efficient design of phase 3 trials. We aimed to determine the relationship of treatment effect size estimates from phase 2 and phase 3 clinical trials on advanced therapeutics in inflammatory bowel disease.
METHODS:
MEDLINE, EMBASE, CENTRAL, and the Cochrane library were searched from inception to December 19, 2022, to identify paired phase 2 and 3 placebo-controlled induction studies of advanced therapeutics for Crohn's disease (CD) and ulcerative colitis (UC). Treatment effect sizes were expressed as a risk ratio (RR) between the active arm and placebo arm. For the same therapeutics, RRs from phase 2 trials were divided by the RR from phase 3 trial to quantify the relationship of effect sizes between phases.
RESULTS:
Twenty-two studies (9 phase 2 trials, 13 phase 3 trials) were included for CD and 30 studies (12 phase 2 trials, 18 phase 3 trials) for UC. In UC (pooled RR 0.72; 95% confidence interval: 0.58–0.86; RR <1 indicates smaller treatment effect sizes in phase 2 trials), but not CD (pooled RR 1.01; 95% confidence interval: 0.84–1.18), phase 2 trials systematically underestimated treatment effect sizes for the primary endpoint compared with phase 3 trials. The underestimation was observed for clinical, but not endoscopic, endpoints in UC.
DISCUSSION:
Treatment effect sizes for the primary and clinical endpoints were similar across clinical trial phases in CD, but not UC, where only endoscopic endpoints were comparable. This will help inform clinical development plans and future trial design.
KEYWORDS: Crohn's disease, ulcerative colitis, monoclonal antibodies, biologics, small molecules
INTRODUCTION
Novel drugs must establish their efficacy and safety in a comprehensive clinical trial program to receive regulatory approval (1). Clinical trial development for novel therapeutics is divided into multiple phases (2). Phase 1 trials investigate safety and human pharmacokinetics by dose ranging for safety in healthy volunteers or patients, whereas phase 2 trials evaluate safety and efficacy by therapeutic dosage in a small number of patients and explore dose-response relationships (3). Subsequently, phase 3 trials provide confirmatory evidence of efficacy and safety by therapeutic dose in a larger number of patients with the disease of interest.
A crucial stage for the development of new drugs in this multistep process is the step from phase 2 to phase 3. Data from phase 2 studies are often used to develop the protocol and trial design for phase 3, including planning sample size requirements based on treatment effect sizes observed in phase 2 (4). Failure of expected endpoints in phase 3 is associated with major use of resources and financial burden but, more importantly, the exposure of study participants to potentially ineffective treatments and risk of harm (5).
In several medical fields, it is unclear whether discrepancies in the outcomes observed between phase 2 and phase 3 trials are the result of chance events, variations in sample sizes, patient population, or a systematic overestimation of the efficacy of investigational compounds during earlier stages of development (6–10).
In a recent study including 51 trials from rheumatology, it was found that phase 2 clinical trials systematically overestimate treatment effects when compared to subsequent phase 3 rheumatoid arthritis trials (8). The authors concluded that using narrower inclusion criteria in phase 2 studies lead to a more conservative estimate of the treatment effect (8).
The number of trials investigating new targeted therapies for Crohn's disease (CD) and ulcerative colitis (UC) has dramatically increased over the past 20 years (3). Understanding differences in efficacy outcomes, and study protocols, in matched phase 2 and 3 studies is important to inform drug development in inflammatory bowel disease (IBD) and design of future programs.
We aimed to compare clinical and endoscopic outcomes in matched phase 2 and 3 randomized clinical trials of approved advanced targeted therapies in CD and UC, looking at treatment effect sizes (difference in the event rates between the active treatment and the placebo arms). We also explored potential reasons for differences observed in the effect size between matched phase 2 and 3 with a meta-regression model to assess the impact of covariates on potential misspecification.
METHODS
Search strategy
We extracted data from placebo-controlled induction trials that had been previously identified in 2 systematic reviews of placebo-controlled trials in CD and UC (11,12). The methodologies of the 2 reviews used as the data sources for this study have been previously reported. In brief, MEDLINE, EMBASE, the Cochrane CENTRAL register of controlled trials, and the Cochrane Inflammatory Bowel Disease Review Group's Specialized Trials Register were originally searched from inception to March 26, 2021, without language restriction. Studies included in the 2 systematic reviews based on this search were assessed for eligibility for the current analysis. A new search using the same strategy was extended from March 26, 2021, to December 19, 2022, to capture more recently published trials. The search strategies for CD and UC trials are reported in the Supplementary Digital Content (see Supplementary Appendix, http://links.lww.com/CTG/A993). We also hand-searched conference proceedings from Digestive Disease Week and United European Gastroenterology Week as well as bibliographies of review articles and meta-analyses to identify additional trials.
Study selection and eligibility criteria
The following studies were eligible for inclusion: (i) placebo-controlled induction trial, (ii) evaluation of a biologic agent or small molecule, (iii) enrollment of adults with moderately to severely active luminal CD or UC, and (iv) phase 2 or phase 3 clinical trials. Trials enrolling specifically patients for evaluating perianal fistulizing CD or postoperative recurrence were excluded. We also excluded trials of hospitalized patients with acute severe UC. Maintenance trials were excluded from this study because blinded maintenance studies are infrequent in phase 2 and maintenance phase 3 trials typically use designs with re-randomization of induction-phase responders. Given that only responders are re-randomized, treatment effect sizes would not be comparable with those observed in induction studies or studies with a treat-through design.
Additional study eligibility criteria were paired phase 2 and phase 3 trials of the same drug in the same disease. Phase 2 trials without a subsequent phase 3 trial and phase 3 trials without a preceding phase 2 trial were excluded. Trials were also excluded if they did not report the same outcome at a similar time point in phase 2 and phase 3. The same drug dosages were paired across trial phases; however, if identical dosages were not compared between phases, the phase 2 dosing arm closest to the phase 3 dosage was used. At a minimum, trials had to report clinical response or remission, although not necessarily as the primary endpoint.
Data extraction
The studies were independently screened by 2 investigators (J.H. and V.S.) and any disagreements were resolved by consensus with a third author (V.J.). The proportion of patients achieving clinical response, clinical remission, endoscopic response (in CD), endoscopic remission (both in CD and UC, defined as a Mayo endoscopic score of 0 for the latter), and endoscopic improvement (UC: Mayo endoscopic score ≤1) were collected. The proportions were extracted from both the active treatment and the placebo arm. All proportions were extracted as intention to treat.
The following trial characteristics were extracted: (i) trial design and participant characteristics (trial development phase, year of publication, study location[s], first-author country, number of participants, study duration, number of follow-up visits, frequency of follow-up visits, and mean age); (ii) type of intervention (drug class, concomitant therapy, route of administration, frequency of administration, and ratio of active drug to placebo); (iii) criteria for enrollment and outcome assessment (CD: minimum Crohn's Disease Activity Index score for inclusion; Crohn's Disease Activity Index–based definitions of response and remission; UC: minimum [modified] Mayo score for inclusion; [modified] Mayo-based definitions of response and remission as prespecified in the primary trial), including use of endoscopy and minimum endoscopic score on enrollment; and (iv) disease severity and duration (baseline C-reactive protein [CRP], disease distribution [in CD], pancolitis [in UC], disease duration, previous surgery, and previous biological therapy).
Data synthesis and statistical analysis
The treatment effect size for each individual endpoint within a given trial was expressed as a risk ratio (RR) dividing the proportion of patients achieving the endpoint in the active treatment arm by the proportion of patients achieving the endpoint in the placebo arm. RR >1 therefore denotes that the percentage of patients in the active treatment arm achieving the endpoint was higher than that in the placebo arm. Analyses were performed separately for CD and UC and separately by endpoint (primary endpoint, clinical response, clinical remission, endoscopic response [in CD], endoscopic remission [both in CD and UC, defined as a Mayo endoscopic score of 0 for the latter], and endoscopic improvement [in UC: Mayo endoscopic score ≤1]).
RRs were pooled per study phase by individual drug. Ninety-five percent confidence intervals (CIs) were calculated by first constructing the CI on the log-relative risk scale and then converting the result to the relative risk scale.
To determine whether treatment effect sizes were systematically overestimated in phase 2 trials compared with the subsequent matched phase 3 trial, the RR for the phase 2 trial was divided by the RR for the phase 3 trial of the same drug in the same disease. A RR <1 indicates that the treatment effect size was smaller in the phase 2 trial than that in the phase 3 trial. These quotients of RR were pooled by individual drug.
To assess the impact of study-level characteristics on the difference in effect sizes between clinical trial phases, separate cluster linear regression with robust standard errors for each characteristic was fitted to the data with the RR for the primary endpoint as the dependent variable and potentially explanatory covariables as independent variables. These analyses were performed on all trials, stratified by phase and not matched by studied drug. For CD trials with clinical remission and endoscopic response as co-primary endpoints (13–15), the former was used as the primary endpoint for the purpose of this analysis. The method of estimation used was weighted least squares with the inverse of the variance of the effect estimate as the weights. Statistically significant terms (2-sided P value < 0.05; for categorical variables, significance was assessed using the F-test) were then assessed in a multiple regression model. The model was fitted using the same methodology as outlined above except all significant terms were included as independent variables.
RESULTS
Search results
For CD, the search yielded 20,156 citations, of which 8,129 were duplicates. Of the remaining citations, 627 were reviewed for eligibility, with 50 induction studies considered potentially eligible for extraction. One study was excluded because it did not have a matching phase 2 study in CD, 23 studies were excluded because they did not have a matching phase 3 study, and 4 studies were excluded because of substantial design differences between phase 2 and 3 (1 study used dosing with the active drug in induction in all patients; 1 phase 2 induction study was a cross-over study with doses not comparable to the phase 3 study; and 1 phase 2 study was an induction-only study and the phase 3 study of the same drug was maintenance-only with open-label induction) yielding 22 studies (9 phase 2 trials, 13 phase 3 trials) (Figure 1a, Table 1, see Supplementary Table 1, http://links.lww.com/CTG/A993) (13–33).
Figure 1.
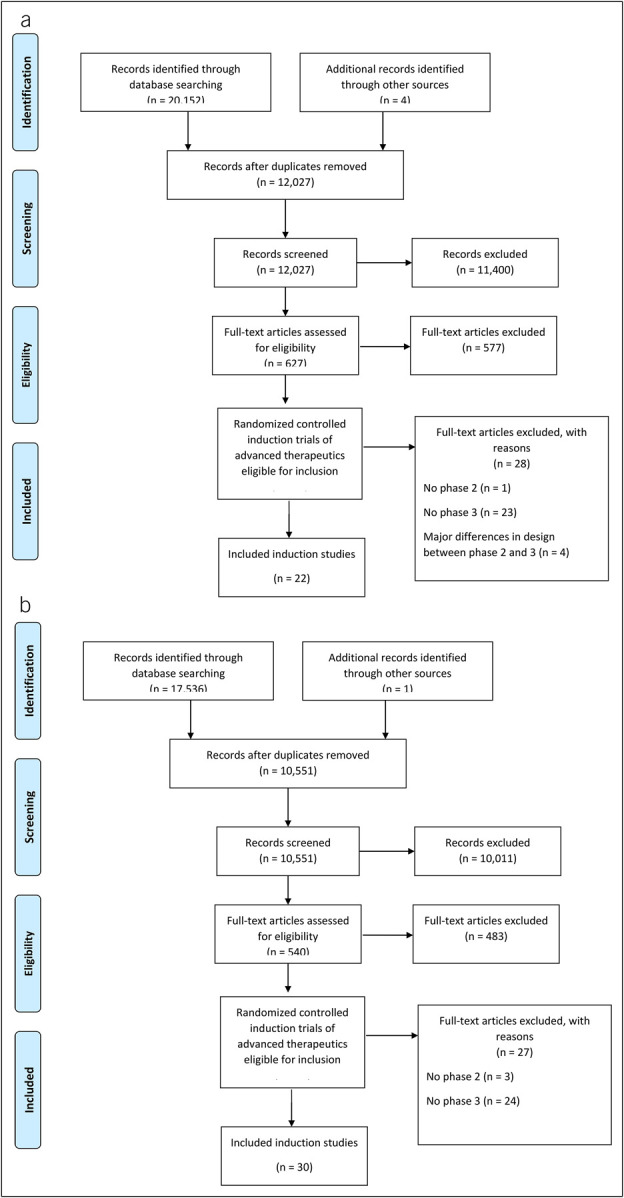
Study flow diagram for Crohn's disease (a) and ulcerative colitis (b).
Table 1.
Included studies
| Crohn's disease (N = 22) | ||||
| Study | Trial phase | Drug | Dosage | |
| 1 | Gordon 2001 (16) | 2 | Natalizumab | 3 mg/kg |
| 2 | Ghosh 2003 (17) | 2 | Natalizumab | 3 mg/kg |
| 3 | Sandborn 2005 (18) | 3 | Natalizumab | 300 mg |
| 4 | Targan 2007 (19) | 3 | Natalizumab | 300 mg |
| 5 | Schreiber 2005 (20) | 2 | Certolizumab | 400 mg |
| 6 | Sandborn 2007 (21) | 3 | Certolizumab | 400 mg |
| 7 | Sandborn 2011 (22) | 3 | Certolizumab | 400 mg |
| 8 | Hanauer 2006 (23) | 2 | Adalimumab | 160/80 mg |
| 9 | Sandborn 2007 (24) | 3 | Adalimumab | 160/80 mg |
| 10 | Feagan 2008 (25) | 2 | MLN02 (Vedolizumab) | 3 mg/kg |
| 11 | Sandborn 2013 (26) | 3 | Vedolizumab | 300 mg |
| 12 | Sands 2014 (27) | 3 | Vedolizumab | 300 mg |
| 13 | Sandborn 2012 (28) | 2 | Ustekinumab | 6 mg/kg |
| 14 | Feagan 2016 (29) | 3 | Ustekinumab | 130 mg/6 mg/kg |
| 15 | Monteleone 2015 (30) | 2 | Mongersen | 160 mg |
| 16 | Sands 2020 (31) | 3 | Mongersen | 160 mg |
| 17 | Sandborn 2020 (32) | 2 | Upadacitinib | 24 mg BID |
| 18 | Colombel 2022 (14) | 3 | Upadacitinib | 45 mg |
| 19 | Loftus 2022 (15) | 3 | Upadacitinib | 45 mg |
| 20 | Feagan 2017 (33) | 2 | Risankizumab | 600 mg |
| 21 | D'Haens 2022 (ADVANCE) (13) | 3 | Risankizumab | 600 mg |
| 22 | D'Haens 2022 (MOTIVATE) (13) | 3 | Risankizumab | 600 mg |
| Ulcerative colitis (N = 30) | ||||
| Study | Trial phase | Drug | Dosage | |
| 1 | Feagan 2005 (34) | 2 | MLN02 (Vedolizumab) | 2 mg/kg |
| 2 | Parikh 2012 (35) | 2 | Vedolizumab | 6 mg/kg |
| 3 | Feagan 2013 (36) | 3 | Vedolizumab | 300 mg |
| 4 | Motoya 2019 (37) | 3 | Vedolizumab | 300 mg |
| 5 | Probert 2003 (38) | 2 | Infliximab | 5 mg/kg |
| 6 | Rutgeerts 2005 (ACT 1) (39) | 3 | Infliximab | 5 mg/kg |
| 7 | Rutgeerts 2005 (ACT 2) (39) | 3 | Infliximab | 5 mg/kg |
| 8 | Sandborn 2012 (40) | 2 | Tofacitinib | 10 mg BID |
| 9 | Sandborn 2017 (OCTAVE 1) (41) | 3 | Tofacitinib | 10 mg BID |
| 10 | Sandborn 2017 (OCTAVE 2) (41) | 3 | Tofacitinib | 10 mg BID |
| 11 | Sandborn 2014 (42) | 2 | Golimumab | 200/100 mg |
| 12 | Sandborn 2014 (42) | 2 | Golimumab | 400/200 mg |
| 13 | Sandborn 2014 (42) | 3 | Golimumab | 200/100 mg |
| 14 | Sandborn 2014 (42) | 3 | Golimumab | 400/200 mg |
| 15 | Sandborn 2016 (43) | 2 | Ozanimod | 1 mg |
| 16 | Sandborn 2021 (44) | 3 | Ozanimod | 1 mg |
| 17 | Sandborn 2020 (45) | 2 | Upadacitinib | 45 mg q.d. |
| 18 | Danese 2022 (U-ACHIEVE) (46) | 3 | Upadacitinib | 45 mg q.d. |
| 19 | Danese 2022 (U-ACCOMPLISH) (46) | 3 | Upadacitinib | 45 mg q.d. |
| 20 | Sandborn 2020 (47) | 2 | Mirikizumab | 200 mg (exposure based) |
| 21 | D'Haens 2022 (48) | 3 | Mirikizumab | 300 mg |
| 22 | Vermeire 2014 (49) | 2 | Etrolizumab | 100 mg |
| 23 | Peyrin Biroulet 2021 (50) | 3 | Etrolizumab | 105 mg |
| 24 | Rubin 2021 (HIBISCUS 1) (51) | 3 | Etrolizumab | 105 mg |
| 25 | Rubin 2021 (HIBISCUS 2) (51) | 3 | Etrolizumab | 105 mg |
| 26 | Yoshimura 2015 (52) | 2 | AJM300 | 960 mg |
| 27 | Matsuoka 2022 (53) | 3 | AJM300 | 960 mg |
| 28 | Sandborn 2020 (54) | 2 | Etrasimod | 2 mg |
| 29 | Sandborn 2023 (ELEVATE-12) (55) | 3 | Etrasimod | 2 mg |
| 30 | Sandborn 2023 (ELEVATE-52) (55) | 3 | Etrasimod | 2 mg |
For UC, the search yielded 17,537 citations, of which 6,986 were duplicates. Of the remaining citations, 540 were reviewed for eligibility, with 57 induction studies considered potentially eligible for extraction. Three studies were excluded because they did not have a matching phase 2 study in UC, and 24 studies were excluded because they did not have a matching phase 3 study in UC yielding 30 studies (12 phase 2 trials, 18 phase 3 trials) (Figure 1b, Table 1, see Supplementary Table 1, http://links.lww.com/CTG/A993) (34–55).
Treatment effect sizes in phase 2 and phase 3 trials in CD
For CD, pooled effect sizes for the primary endpoint were similar between unmatched phase 2 (RR 1.40; 95% CI: 1.21–1.58) and phase 3 trials (RR 1.45; 95% CI: 1.26–1.65) (Figures 2a,b). Comparing treatment effect sizes for the primary endpoint in matched phase 2 and phase 3 trials showed no evidence for systematic mismatch between trial phases (pooled RR 1.01; 95% CI: 0.84–1.18; RR >1 indicates larger treatment effect sizes in phase 2 trials) (Table 2). Evaluating individual endpoints, there was no evidence for systematic mismatch between trial phases for any individual endpoint (Table 2).
Figure 2.

Pooled treatment effect sizes (expressed as risk ratios between the active treatment arm and the placebo arm) for the primary endpoint in phase 2 trials for Crohn's disease (a), phase 3 trials for Crohn's disease (b), phase 2 trials for ulcerative colitis (c), and phase 3 trials for ulcerative colitis (d). DL, DerSimonian-Laird estimator.
Table 2.
Treatment effect sizes across paired phase 2 and 3 trials in Crohn's disease
| Drug | Primary endpoint | Clinical remission | Clinical response | Endoscopic response | Endoscopic remission |
| Adalimumab | 0.97 (0.44–2.11) | 0.97 (0.44–2.11) | 1.22 (0.84–1.77) | Not reported | Not reported |
| Certolizumab | 0.98 (0.73–1.32) | 0.82 (0.53–1.28) | 0.98 (0.73–1.32) | Not reported | Not reported |
| Certolizumab | 1.03 (0.72–1.47) | 0.81 (0.52–1.26) | 1.08 (0.79–1.47) | Not reported | Not reported |
| Mongersen | 7.51 (2.74–20.56) | 7.51 (2.74–20.56) | 3.31 (1.83–5.99) | Not reported | Not reported |
| Natalizumab | 1.41 (0.84–2.35) | 1.34 (0.78–2.31) | 1.76 (1.17–2.64) | Not reported | Not reported |
| Natalizumab | 1.09 (0.64–1.86) | 1.01 (0.55–1.84) | 1.36 (0.89–2.10) | Not reported | Not reported |
| Risankizumab | 2.15 (0.94–4.92) | 2.15 (0.94–4.92) | 2.33 (1.19–4.56) | 0.85 (0.31–2.33) | 6.12 (0.78–48.04) |
| Risankizumab | 1.87 (0.81–4.36) | 1.87 (0.81–4.36) | 1.91 (0.96–3.79) | 1.11 (0.40–3.09) | 1.681 (0.193, 14.597) |
| Upadacitinib | 1.11 (0.35–3.53) | 1.11 (0.35–3.53) | 1.12 (0.58–2.13) | Not reported | Division by 0 |
| Upadacitinib | 1.21 (0.39–3.76) | 1.21 (0.39–3.76) | 1.25 (0.70–2.22) | 3.84 (0.51–29.01) | Division by 0 |
| Ustekinumab | 1.08 (0.67–1.73) | 0.40 (0.17–0.94) | 1.08 (0.67–1.73) | Not reported | Not reported |
| Vedolizumab | 0.59 (0.27–1.28) | 0.83 (0.34–2.05) | 1.55 (0.96–2.50) | Not reported | Not reported |
| Vedolizumab | 1.01 (0.51–1.99) | 1.42 (0.63–3.22) | 0.72 (0.43–1.21) | Not reported | Not reported |
| Pooled treatment effect size | 1.01 (0.84–1.18) | 0.85 (0.64–1.05) | 1.18 (0.98–1.38) | 0.96 (0.15–1.76) | 2.06 (0–8.95) |
Treatment effect sizes across trial phases are expressed as a ratio of risk ratios with 95% confidence intervals. Ratios >1 indicate larger treatment effect sizes in phase 2 trials. Not all endpoints were reported in all trials. If an event rate in a trial arm was 0, ratios could not be computed because of division by 0. Multiple occurrences of the same drug refer to multiple different phase 2 and phase 3 trial pairings.
Trial design and participant characteristics associated with smaller treatment effect sizes for the primary endpoint across all CD trials were younger mean patient age, greater percentage of patients treated with concomitant immunomodulators, greater number of follow-up visits, the absence of endoscopic activity as an inclusion criterion, and the absence of endoscopic improvement as a component of the primary outcome (Table 3). On multivariable regression, only the absence of endoscopic activity as an inclusion criterion was significantly associated with smaller treatment effect sizes across all CD trials (Table 3).
Table 3.
Trial design and patient characteristics associated with treatment effect sizes in trials in Crohn's disease
| Covariate | Univariable regression | Multivariable regression | ||
| Coefficient | P value | Coefficient | P value | |
| Mean age in the active arm (per 1-yr increase) | 0.088 | 0.020 | 0.004 | 0.928 |
| Mean age in the placebo arm (per 1-yr increase) | 0.011 | 0.761 | ||
| Mean/median CDAI in the active arm (per 1-point increase) | −0.003 | 0.378 | ||
| Mean/median CDAI in the placebo arm (per 1-point increase) | 0.002 | 0.765 | ||
| Percentage of ileal disease in the active arm (per 1% increase) | −0.002 | 0.324 | ||
| Percentage of colonic disease in the active arm (per 1% increase) | −0.0009 | 0.726 | ||
| Percentage of ileocolonic disease in the active arm (per 1% increase) | −0.006 | 0.418 | ||
| Percentage of ileal disease in the placebo arm (per 1% increase) | −0.002 | 0.472 | ||
| Percentage of colonic disease in the placebo arm (per 1% increase) | 0.007 | 0.134 | ||
| Percentage of ileocolonic disease in the placebo arm (per 1% increase) | 0.001 | 0.581 | ||
| Mean disease duration in the active arm (per 1-yr increase) | 0.044 | 0.352 | ||
| Mean disease duration in the placebo arm (per 1-yr increase) | 0.043 | 0.296 | ||
| Percentage of concomitant immunosuppressants in the active arm (per 1% increase) | −0.012 | 0.017 | −0.019 | 0.116 |
| Percentage of concomitant immunosuppressants in the placebo arm (per 1% increase) | −0.010 | 0.041 | −0.003 | 0.806 |
| Percentage of concomitant steroids in the active arm (per 1% increase) | −0.002 | 0.758 | ||
| Percentage of concomitant steroids in the placebo arm (per 1% increase) | −0.014 | 0.287 | ||
| Percentage of previous biologics in the active arm (per 1% increase) | −0.002 | 0.559 | ||
| Percentage of previous biologics in the placebo arm (per 1% increase) | −0.002 | 0.590 | ||
| Percentage of patients with prior surgery in active arm (per 1% increase) | −0.013 | 0.452 | ||
| Percentage of patients with previous surgery in the placebo arm (per 1% increase) | −0.013 | 0.431 | ||
| Mean/median baseline CRP in the active arm (per 1 mg/L increase) | −0.007 | 0.482 | ||
| Mean/median baseline CRP in the placebo arm (per 1 mg/L increase) | −0.006 | 0.502 | ||
| No. of follow-up visits (per 1 visit increase) | −0.042 | 0.033 | 0.022 | 0.419 |
| Duration of follow-up in wk (per 1-wk increase) | −0.007 | 0.206 | ||
| Setting (multicenter single country vs multicenter multi-country) | 0.069 | 0.423 | ||
| First-author country (Europe vs North America) | 0.031 | 0.823 | ||
| Drug class (vs anti-TNF as reference) | JAK inhibitor | 0.262 | NS | |
| Anti-IL-12/23 | 0.330 | |||
| Anti-integrin | −0.037 | |||
| Other | −0.209 | |||
| Route of administration (vs oral as reference) | Intravenous | −0.037 | 0.7341 | |
| Subcutaneous | −0.123 | |||
| Not using endoscopic activity as an inclusion criterion (vs using endoscopic activity as an inclusion criterion) | −0.250 | 0.039 | −0.399 | 0.030 |
| Endoscopic response as co-primary endpoint (vs no endoscopic co-primary endpoint) | −0.299 | 0.001 | 0.224 | 0.281 |
| Randomization ratio active drug vs placebo (>1 vs ≤ 1) | −0.136 | 0.254 | ||
CDAI, Crohn's Disease Activity Index; CRP, C-reactive protein; IL, interleukin; JAK, Janus kinase; TNF, tumor necrosis factor.
Entries in bold denote P < 0.05 in the regression analysis.
Treatment effect sizes in phase 2 and phase 3 trials in UC
For UC, pooled effect sizes for the primary endpoint in unmatched trials were higher in phase 3 (RR 1.75; 95% CI: 1.58–1.93) compared with phase 2 trials (RR 1.41; 95% CI: 1.20–1.62) (Figures 2c,d). Comparing treatment effect sizes for the primary endpoint in matched phase 2 and phase 3 trials showed evidence for systematic underestimation of treatment effect sizes in phase 2 trials (pooled RR 0.72; 95% CI: 0.58–0.86; RR >1 indicates larger treatment effect sizes in phase 2 trials) (Table 4). Evaluating individual endpoints, clinical, but not endoscopic, endpoints showed evidence of treatment effect size underestimation in phase 2 trials.
Table 4.
Treatment effect sizes across paired phase 2 and 3 trials in ulcerative colitis
| Drug | Primary outcome | Clinical remission | Clinical response | Endoscopic improvement | Endoscopic remission |
| AJM300 | 1.14 (0.58–2.23) | 3.69 (0.77–17.68) | 1.14 (0.58–2.23) | 0.97 (0.53–1.79) | Not reported |
| Etrasimod | 2.81 (0.91–8.73) | 2.81 (0.91–8.73) | 0.99 (0.58–1.68) | 1.39 (0.64–3.03) | Not reported |
| Etrasimod | 1.26 (0.38–4.17) | 1.26 (0.38–4.17) | 0.82 (0.48–1.39) | 0.911 (0.42–2.00) | Not reported |
| Etrolizumab | Division by 0 | Division by 0 | 0.69 (0.33–1.45) | 1.33 (0.50–3.56) | Not reported in the phase 2 trial |
| Etrolizumab | Division by 0 | Division by 0 | 0.88 (0.43–1.81) | 0.97 (0.35–2.71) | Not reported in the phase 2 trial |
| Etrolizumab | Division by 0 | Division by 0 | 0.74 (0.35–1.57) | 1.34 (0.50–3.64) | Not reported in the phase 2 trial |
| Golimumab | 0.81 (0.52–1.26) | 0.94 (0.35–2.47) | 0.81 (0.52–1.26) | 1.00 (0.61–1.64) | Not reported |
| Golimumab | 0.75 (0.49–1.17) | 0.93 (0.35–2.46) | 0.75 (0.49–1.17) | 0.94 (0.58–1.53) | Not reported |
| Golimumab | 0.73 (0.47–1.15) | 0.65 (0.23–1.78) | 0.73 (0.47–1.15) | 0.87 (0.52–1.44) | Not reported |
| Golimumab | 0.68 (0.43–1.07) | 0.64 (0.23–1.77) | 0.68 (0.43–1.07) | 0.81 (0.49–1.35) | Not reported |
| Infliximab | 0.70 (0.29–1.69) | 0.50 (0.19–1.32) | Not reported in the phase 2 trial | Not reported in the phase 2 trial | Not reported in the phase 3 trial |
| Infliximab | 0.59 (0.24–1.45) | 0.22 (0.07–0.68) | Not reported in the phase 2 trial | Not reported in the phase 2 trial | Not reported in the phase 3 trial |
| Mirikizumab | 2.60 (0.75–8.96) | 2.60 (0.75–8.96) | 1.92 (1.11–3.31) | 2.81 (0.98–7.99) | Not reported |
| Ozanimod | 0.87 (0.26–2.98) | 0.87 (0.26–2.98) | 0.83 (0.53–1.31) | 1.18 (0.52–2.72) | Not reported in the phase 3 trial |
| Tofacitinib | 0.65 (0.30–1.38) | 2.06 (0.69–6.17) | 0.80 (0.48–1.32) | Not reported in the phase 2 trial | 3.55 (0.30–41.34) |
| Tofacitinib | 0.31 (0.11–0.92) | 1.00 (0.26–3.82) | 0.76 (0.45–1.28) | Not reported in the phase 2 trial | 3.71 (0.32–43.33) |
| Upadacitinib | Division by 0 | Division by 0 | 1.44 (0.62–3.31) | 3.23 (0.41–25.22) | Division by 0 |
| Upadacitinib | Division by 0 | Division by 0 | 1.30 (0.57–2.99) | 3.01 (0.39–23.03) | Division by 0 |
| Vedolizumab | 0.93 (0.32–2.72) | Not reported in the phase 2 trial | 0.93 (0.32–2.72) | Not reported in the phase 2 trial | Not reported |
| Vedolizumab | 1.42 (0.48–4.24) | Not reported in the phase 2 trial | 1.42 (0.48–4.24) | Not reported in the phase 2 trial | Not reported |
| Vedolizumab | 1.20 (0.55–2.60) | 0.71 (0.25–1.96) | 0.87 (0.51–1.46) | 0.89 (0.29–2.79) | Not reported |
| Vedolizumab | 1.84 (0.83–4.10) | 1.48 (0.56–3.91) | 1.33 (0.76–2.32) | 1.23 (0.39–3.90) | Not reported |
| Pooled treatment effect size | 0.72 (0.58–0.86) | 0.50 (0.29–0.71) | 0.82 (0.71–0.94) | 0.95 (0.76–1.15) | 3.63 (0–18.47) |
Treatment effect sizes across trial phases are expressed as a ratio of risk ratios with 95% confidence intervals. Ratios >1 indicate larger treatment effect sizes in phase 2 trials. Not all endpoints were reported in all trials. If an event rate in a trial arm was 0, ratios could not be computed because of division by 0. Multiple occurrences of the same drug refer to multiple different phase 2 and phase 3 trial pairings.
Trial design and participant characteristics associated with smaller treatment effect sizes for the primary endpoint in unmatched UC trials were a greater percentage of patients with extensive colitis, greater percentage of patients treated with concomitant immunomodulators, higher mean CRP at baseline, the absence of rectal bleeding as an inclusion criterion, and the absence of improvement in rectal bleeding as a component of the primary endpoint (Table 5). On multivariable regression, the absence of rectal bleeding as an inclusion criterion was significantly associated with smaller treatment effect sizes in unmatched trials (Table 5). In a sensitivity analysis separating trials by the threshold of the rectal bleeding score required to define clinical remission, the effect sizes in phase 2 trials were smaller in matched trials using a rectal bleeding score of ≤1 (RR 0.47; 95% CI 0.25–0.68), whereas no significant difference in effect sizes by trial phase was observed in matched trials requiring a rectal bleeding score of 0 to define remission (RR 1.16; 95% CI 0.18–2.14).
Table 5.
Trial design and patient characteristics associated with treatment effect sizes in trials in ulcerative colitis
| Covariate | Univariable regression | Multivariable regression | ||
| Coefficient | P value | Coefficient | P value | |
| Mean age in the active arm (per 1-yr increase) | −0.030 | 0.107 | ||
| Mean age in the placebo arm (per 1-yr increase) | −0.038 | 0.096 | ||
| Mean total Mayo score in the active arm (per 1-point increase) | −0.254 | 0.141 | ||
| Mean total Mayo score in the placebo arm (per 1-point increase) | −0.262 | 0.158 | ||
| Percentage of extensive colitis in the active arm (per 1% increase) | −0.014 | 0.107 | ||
| Percentage of extensive colitis in the placebo arm (per 1% increase) | −0.017 | 0.017 | −0.005 | 0.753 |
| Mean disease duration in the active arm (per 1-yr increase) | −0.040 | 0.104 | ||
| Mean disease duration in the placebo arm (per 1-yr increase) | −0.0008 | 0.99 | ||
| Percentage of concomitant immunosuppressants in the active arm (per 1% increase) | −0.009 | 0.079 | ||
| Percentage of concomitant immunosuppressants in the placebo arm (per 1% increase) | −0.010 | 0.023 | −0.003 | 0.674 |
| Percentage of concomitant steroids in the active arm (per 1% increase) | −0.002 | 0.517 | ||
| Percentage of concomitant steroids in the placebo arm (per 1% increase) | −0.0004 | 0.865 | ||
| Percentage of previous biologics in the active arm (per 1% increase) | 0.003 | 0.516 | ||
| Percentage of previous biologics in the placebo arm (per 1% increase) | 0.003 | 0.485 | ||
| Mean/median baseline CRP in the active arm (per 1 mg/L increase) | −0.054 | 0.019 | 0.003 | 0.807 |
| Mean/median baseline CRP in the placebo arm (per 1 mg/L increase) | −0.040 | 0.135 | ||
| No. of follow-up visits (per 1 visit increase) | −0.122 | 0.647 | ||
| Duration of follow-up in wk (per 1-wk increase) | 0.029 | 0.177 | ||
| Setting (Multicenter single country vs multicenter multi-country) | 0.123 | 0.521 | ||
| First-author country (North America as reference) | Europe | 0.213 | 0.253 | |
| Other | −0.128 | |||
| Drug class (vs anti-TNF as reference) | JAK inhibitor | 0.590 | NS | |
| Anti-IL-12/23 | 0.145 | |||
| Anti-integrin | −0.036 | |||
| Other | 0.486 | |||
| Route of administration (vs oral as reference) | Intravenous | −0.319 | 0.118 | |
| Subcutaneous | −0.379 | |||
| Minimum total Mayo score at entry (≥6 vs <6) | 0.189 | 0.148 | ||
| Bleeding subscore not required at entry (vs required) | −0.370 | 0.009 | −0.493 | 0.037 |
| Improvement in endoscopic subscore not required for endpoint (vs required) | −0.074 | 0.526 | ||
| Improvement in bleeding subscore not required for endpoint (vs required) | −0.296 | 0.012 | −0.156 | 0.674 |
| Randomization ratio active drug vs placebo (>1 vs ≤1) | −0.033 | 0.845 | ||
Entries in bold denote P < 0.05 in the regression analysis.
CRP, C-reactive protein; IL, interleukin; JAK, Janus kinase; TNF, tumor necrosis factor.
DISCUSSION
In this systematic review of phase 2 and phase 3 trials of advanced therapeutics in IBD, we showed that phase 2 trials in CD demonstrated similar treatment effect sizes in subsequent phase 3 trials. In UC, however, phase 2 trials underestimated treatment effect sizes that were observed in subsequent phase 3 trials for the primary endpoint, clinical remission, and clinical response, but not endoscopic endpoints. Trial design variables associated with greater treatment effect sizes in unmatched trials included the use of endoscopy as an inclusion criterion and co-primary endpoint in CD. In UC, greater treatment effect sizes were associated with the use of rectal bleeding as an inclusion criterion and improvement in this symptom as a component of the primary endpoint.
Treatment effect sizes are dependent on the difference in event rates in the active treatment arm and the placebo arm—the latter was ignored in previous studies comparing phase 2 and 3 trials in rheumatology and IBD (8,56). Smaller-than-expected treatment effect sizes across clinical trial phases can be the result of lower rates of remission in the active arm or higher rates of remission in the placebo arm, or both. The results of our study can therefore be interpreted in conjunction with the findings of 2 recently published meta-analyses exploring factors affecting placebo rates in trials of IBD (11,12). Two variables associated with smaller treatment effect sizes in our regression analysis for CD, a greater number of follow-up visits and not using endoscopic assessment as an inclusion criterion, are closely associated with higher placebo rates. Higher placebo rates observed with increasing numbers of follow-up visits probably reflect the impact of the interaction between the patient and the physician on symptomatic improvement (57,58). Declining placebo clinical remission rates in recent trials (11) have paralleled the introduction of combined clinical and endoscopic assessment before inclusion into a trial to ensure the presence of active disease.
Several variables reflecting more refractory disease associated with lower remission rates in the active treatment arm were identified in our regression analysis. These included concomitant use of immunomodulators (both in CD and UC), higher baseline CRP, and the percentage of patients with extensive colitis (the latter 2 variables in UC). These variables are simultaneously associated with lower placebo remission rates and lower remission rates in the active treatment arm—their ultimate impact on treatment effect sizes depends on the ratio of decrease in each of the trial arms. A higher percentage of patients with extensive UC has previously been shown to be associated with an overestimation of treatment effect sizes during sample size calculation before the conduct of the trial in comparison to the ultimately observed trial results (10). Given the more widespread use of biologics where the benefit of combination therapy with immunosuppressants is uncertain (59,60) and trials where concomitant treatment with immunosuppressants is an exclusion criterion (44,46), this patient characteristic is less likely to be as relevant for future trials.
In this study, we ensured that the same endpoints were compared across clinical trial phases for the same treatment agent. The primary endpoint in CD trials remained practically unchanged throughout the inclusion period with definitions of remission and response based on the CD Activity Index (61) with the notable exception of endoscopic response as a co-primary endpoint in the most recently completed phase 3 trials (13–15). In UC, clinical remission definitions in recent trials have shifted from a rectal bleeding score of ≤1 toward a rectal bleeding score of 0 (44,46,50,51). In a sensitivity analysis separating trials by the rectal bleeding score threshold to define remission, smaller effect sizes in phase 2 trials for clinical remission were observed for trials using a threshold of ≤1, but not for trials using a threshold of 0. These findings should be interpreted cautiously as the number of trials using the more stringent definition was smaller with correspondingly broad CIs which do not exclude the possibility of smaller effect sizes in phase 2 trials which we could not detect because of a lack of statistical power. Nonetheless, our results are not inconsistent with the notion that a more stringent definition of clinical remission could lead to a closer association of treatment effect sizes in phase 2 and phase 3 trials.
A systematic review and meta-analysis exploring clinical remission in paired phase 2 and 3 studies in IBD trials was recently published (56). No difference in rates of clinical remission between trial phases was found. Two important differences should be noted in comparison to our study to potentially explain the difference in results. Tandon et al focused on the active treatment arm, ignoring the event rate in the placebo arm, and concentrated on clinical remission, but not clinical response or endoscopic endpoints in CD. The success of a clinical trial and ultimate regulatory approval of the investigational drug depend on the demonstration of superiority over placebo, which emphasizes the need to consider both the active treatment and placebo arm in such analyses. Moreover, endoscopic endpoints are the norm in contemporary phase 2 trials both in CD and UC, which highlights the importance of including these outcomes in analyses. Reassuringly, rates of endoscopic improvement (Mayo endoscopic subscore ≤1) in phase 2 trials of UC were concordant with those in phase 3 trials, while too few studies reported endoscopic remission (Mayo endoscopic subscore 0) to draw meaningful conclusions.
This study gives a comprehensive overview of treatment effect sizes and trial characteristics influencing them in phase 2 and 3 clinical trials of advanced therapeutics in IBD. Limitations of the study should also be acknowledged. Not all therapeutics currently used in IBD could be evaluated in both diseases because of either the absence of a corresponding phase 2 trial (62–65) or differences in trial design across phases (e.g., open-label induction, followed by randomization of responders, and different time points of endpoint assessment) (66,67). The relatively small number of trials per phase and per individual disease also precluded regression analysis evaluating the impact of the interaction of trial characteristics and trial phase on treatment effect sizes. The large time span covered by the included studies may have resulted in different patient characteristics between trials which could not be fully adjusted for using patient characteristics reported in trial publications.
Our systematic review and meta-analysis has shown that treatment effect sizes in matched phase 2 and 3 trials are similar in CD, but not UC. The mismatch in UC was driven by lower rates of symptomatic remission in phase 2 compared with phase 3, whereas rates of endoscopic improvement were concordant across trial phases. Larger treatment effect sizes were associated with objective inclusion criteria and endpoint definitions. These findings will help guide the planning for future clinical development plans in IBD.
CONFLICTS OF INTEREST
Guarantor of the article: Vipul Jairath, MBChB, DPhil.
Specific author contributions: J.H., V.J.: design. J.H., V.S., L.Z., G.Z., V.J.: data acquisition, analysis, and interpretation. J.H., V.S.: manuscript drafting. J.H., V.S., L.Z., G.Z., L.P.-B., S.D., S.S., C.M., P.W., V.J.: critical revision of manuscript for important intellectual content.
Financial support: None to report.
Potential competing interests: J.H. has received speaker's fees from AbbVie, Janssen, and Takeda, and consulting fees from Alimentiv Inc. V.S. has no conflict of interest. L.Z. has no conflict of interest. G.Z. has received consulting fees from Alimentiv. L.P.-B. consulting fees from Galapagos, AbbVie, Janssen, Genentech, Alimentiv, Ferring, Tillots, Celltrion, Takeda, Pfizer, Index Pharmaceuticals, Sandoz, Celgene, Biogen, Samsung Bioepis, Inotrem, Allergan, MSD, Roche, Arena, Gilead, Amgen, BMS, Vifor, Norgine, Mylan, Lilly, Fresenius Kabi, OSE Immunotherapeutics, Enthera, Theravance, Pandion Therapeutics, Gossamer Bio, Viatris, Thermo Fisher, ONO Pharma, Mopac, Cytoki Pharma, Morphic, Prometheus, and Applied Molecular Transport; payment or honoraria for lectures, presentations, speakers bureaus, manuscript writing, or educational events from AbbVie, Galapagos, Janssen, Ferring, Tillots, Celltrion, Takeda, Pfizer, Sandoz, Biogen, MSD, Arena, Gilead, Amgen, Vifor, and Viatris; support for attending meetings and/or travel from AbbVie, Galapagos, Janssen, Ferring, Tillots, Celltrion, Takeda, Pfizer, Sandoz, Biogen, MSD, Arena, Gilead, Amgen, and Vifor; participation on a Data Safety Monitoring Board or Advisory Board from Galapagos, AbbVie, Janssen, Genentech, Alimentiv, Ferring, Tillots, Celltrion, Takeda, Pfizer, Index Pharmaceuticals, Sandoz, Celgene, Biogen, Samsung Bioepis, Inotrem, Allergan, MSD, Roche, Arena, Gilead, Amgen, BMS, Vifor, Norgine, Mylan, Lilly, Fresenius Kabi, OSE Immunotherapeutics, Enthera, Theravance, Pandion Therapeutics, Gossamer Bio, Viatris, Thermo Fisher, ONO Pharma, Mopac, Cytoki Pharma, Morphic, Prometheus, and Applied Molecular Transport; and stocks from CTMA. S.D. has received consultancy fees from AbbVie, Alimentiv, Allergan, Amgen, AstraZeneca, Athos Therapeutics, Biogen, Boehringer Ingelheim, Bristol Myers Squibb, Celgene, Celltrion, Dr Falk Pharma, Eli Lilly, Enthera, Ferring Pharmaceuticals Inc., Gilead, Hospira, Inotrem, Janssen, Johnson & Johnson, Morphic, MSD, Mundipharma, Mylan, Pfizer, Roche, Sandoz, Sublimity Therapeutics, Takeda, Teladoc Health, TiGenix, UCB Inc., Vial, and Vifor and lecture fees from AbbVie, Amgen, Ferring Pharmaceuticals Inc., Gilead, Janssen, Mylan, Pfizer, and Takeda. S.S. has received personal fees from Pfizer for ad hoc grant review and research funding from Pfizer and AbbVie. C.M. has received consulting fees from AbbVie, Alimentiv, Amgen, AVIR Pharma Inc, BioJAMP, Bristol Myers Squibb, Celltrion, Ferring, Fresenius Kabi, Janssen, McKesson, Mylan, Pendopharm, Pfizer, Prometheus Biosciences Inc., Roche, Sanofi, Takeda, and Tillotts Pharma; speaker's fees from AbbVie, Amgen, AVIR Pharma Inc, Alimentiv, Bristol Myers Squibb, Ferring, Fresenius Kabi, Janssen, Organon, Pendopharm, Pfizer, and Takeda; royalties from Springer Publishing; and research support from Ferring and Pfizer. P.W. has no conflict of interest. V.J. has received consulting/advisory board fees from AbbVie, Alimentiv, Arena Pharmaceuticals, Asahi Kasei Pharma, Asieris, AstraZeneca, Bristol Myers Squibb, Celltrion, Eli Lilly, Ferring, Flagship Pioneering, Fresenius Kabi, Galapagos, GlaxoSmithKline, Genentech, Gilead, Janssen, Merck, Metacrine, Mylan, Pandion, Pendopharm, Pfizer, Protagonist, Prometheus, Reistone Biopharma, Roche, Sandoz, Second Genome, Sorriso Pharmaceuticals, Takeda, Teva, TopiVert, Ventyx, and Vividion and speaker's fees from AbbVie, Ferring, Bristol Myers Squibb, Galapagos, Janssen, Pfizer, Shire, Takeda, and Fresenius Kabi. All authors have approved the final version of the manuscript, including the authorship list.
Supplementary Material
Footnotes
SUPPLEMENTARY MATERIAL accompanies this paper at http://links.lww.com/CTG/A993
Contributor Information
Jurij Hanzel, Email: jurij.hanzel@gmail.com.
Virginia Solitano, Email: vsolitano@uwo.ca.
Lily Zou, Email: l25zou@uwaterloo.ca.
G.Y. Zou, Email: gy.zou@alimentiv.com.
Laurent Peyrin-Biroulet, Email: peyrinbiroulet@gmail.com.
Silvio Danese, Email: sdanese@hotmail.com.
Siddharth Singh, Email: sis040@health.ucsd.edu.
Christopher Ma, Email: Christopher.ma@ucalgary.ca.
Pauline Wils, Email: pauline.kerbage@chu-lille.fr.
REFERENCES
- 1.Sedgwick P. What are the four phases of clinical research trials? BMJ 2014;348(1):g3727. [DOI] [PubMed] [Google Scholar]
- 2.Robuck PR, Wurzelmann JI. Understanding the drug development process. Inflamm Bowel Dis 2005;11(Suppl 1):S13–6. [DOI] [PubMed] [Google Scholar]
- 3.Harris MS, Wichary J, Zadnik M, et al. Competition for clinical trials in inflammatory bowel diseases. Gastroenterology 2019;157(6):1457–61.e2. [DOI] [PubMed] [Google Scholar]
- 4.Morgan P, Van Der Graaf PH, Arrowsmith J, et al. Can the flow of medicines be improved? Fundamental pharmacokinetic and pharmacological principles toward improving phase II survival. Drug Discov Today 2012;17(9-10):419–24. [DOI] [PubMed] [Google Scholar]
- 5.Halpern SD, Karlawish JH, Berlin JA. The continuing unethical conduct of underpowered clinical trials. JAMA 2002;288(3):358–62. [DOI] [PubMed] [Google Scholar]
- 6.Vreman RA, Belitser SV, Mota ATM, et al. Efficacy gap between phase II and subsequent phase III studies in oncology. Br J Clin Pharmacol 2020;86(7):1306–13. [DOI] [PMC free article] [PubMed] [Google Scholar]
- 7.Vaduganathan M, Greene SJ, Ambrosy AP, et al. The disconnect between phase II and phase III trials of drugs for heart failure. Nat Rev Cardiol 2013;10(2):85–97. [DOI] [PubMed] [Google Scholar]
- 8.Kerschbaumer A, Smolen JS, Herkner H, et al. Efficacy outcomes in phase 2 and phase 3 randomized controlled trials in rheumatology. Nat Med 2020;26(6):974–80. [DOI] [PubMed] [Google Scholar]
- 9.Zia MI, Siu LL, Pond GR, et al. Comparison of outcomes of phase II studies and subsequent randomized control studies using identical chemotherapeutic regimens. J Clin Oncol 2005;23(28):6982–91. [DOI] [PubMed] [Google Scholar]
- 10.Bahnam P, Hanzel J, Ma C, et al. Most placebo-controlled trials in inflammatory bowel disease were underpowered because of overestimated drug efficacy rates: Results from a systematic review of induction studies. J Crohn's Colitis 2022;17(3):404–17. [DOI] [PubMed] [Google Scholar]
- 11.Almradi A, Sedano R, Hogan M, et al. Clinical, endoscopic, and safety placebo rates in induction and maintenance trials of Crohn's disease: Meta-analysis of randomised controlled trials. J Crohns Colitis 2022;16(5):717–36. [DOI] [PubMed] [Google Scholar]
- 12.Sedano R, Hogan M, Nguyen TM, et al. Systematic review and meta-analysis: Clinical, endoscopic, histological and safety placebo rates in induction and maintenance trials of ulcerative colitis. J Crohns Colitis 2022;16(2):224–43. [DOI] [PubMed] [Google Scholar]
- 13.D'Haens G, Panaccione R, Baert F, et al. Risankizumab as induction therapy for Crohn's disease: Results from the phase 3 ADVANCE and MOTIVATE induction trials. Lancet 2022;399(10340):2015–30. [DOI] [PubMed] [Google Scholar]
- 14.Colombel J-F, Panes J, Lacerda AP, et al. 867f: Efficacy and safety of upadacitinib induction therapy in patients with moderately to severely active Crohn's disease who failed prior biologics: Results from a randomized phase 3 U-EXCEED study. Gastroenterology 2022;162(7):S1394. [Google Scholar]
- 15.Loftus E, Colombel J-F, Lacerda A, et al. Efficacy and safety of upadacitinib induction therapy in patients with moderately to severely active Crohn's disease: Results from a randomized phase 3 U-EXCEL study. United Eur Gastroenterol J 2022;10(8):17. [Google Scholar]
- 16.Gordon FH, Lai CW, Hamilton MI, et al. A randomized placebo-controlled trial of a humanized monoclonal antibody to α4 integrin in active Crohn's disease. Gastroenterol 2001;121(2):268–74. [DOI] [PubMed] [Google Scholar]
- 17.Ghosh S, Goldin E, Gordon FH, et al. Natalizumab for active Crohn's disease. N Engl J Med 2003;348(1):24–32. [DOI] [PubMed] [Google Scholar]
- 18.Sandborn WJ, Colombel JF, Enns R, et al. Natalizumab induction and maintenance therapy for Crohn's disease. N Engl J Med 2005;353(18):1912–25. [DOI] [PubMed] [Google Scholar]
- 19.Targan SR, Feagan BG, Fedorak RN, et al. Natalizumab for the treatment of active Crohn's disease: Results of the ENCORE trial. Gastroenterol 2007;132(5):1672–83. [DOI] [PubMed] [Google Scholar]
- 20.Schreiber S, Rutgeerts P, Fedorak RN, et al. A randomized, placebo-controlled trial of certolizumab pegol (CDP870) for treatment of Crohn's disease. Gastroenterology 2005;129(3):807–18. [DOI] [PubMed] [Google Scholar]
- 21.Sandborn WJ, Feagan BG, Stoinov S, et al. Certolizumab pegol for the treatment of Crohn's disease. N Engl J Med 2007;357(3):228–38. [DOI] [PubMed] [Google Scholar]
- 22.Sandborn WJ, Schreiber S, Feagan BG, et al. Certolizumab pegol for active Crohn's disease: A placebo-controlled, randomized trial. Clin Gastroenterol Hepatol 2011;9(8):670–8.e3. [DOI] [PubMed] [Google Scholar]
- 23.Hanauer SB, Sandborn WJ, Rutgeerts P, et al. Human anti-tumor necrosis factor monoclonal antibody (adalimumab) in Crohn's disease: The CLASSIC-I trial. Gastroenterology 2006;130(2):323–33. [DOI] [PubMed] [Google Scholar]
- 24.Sandborn WJ, Rutgeerts P, Enns R, et al. Adalimumab induction therapy for Crohn disease previously treated with infliximab: A randomized trial. Ann Intern Med 2007;146(12):829–38. [DOI] [PubMed] [Google Scholar]
- 25.Feagan BG, Greenberg GR, Wild G, et al. Treatment of active Crohn's disease with MLN0002, a humanized antibody to the α4β7 integrin. Clin Gastroenterol Hepatol 2008;6(12):1370–7. [DOI] [PubMed] [Google Scholar]
- 26.Sandborn WJ, Feagan BG, Rutgeerts P, et al. Vedolizumab as induction and maintenance therapy for Crohn's disease. N Engl J Med 2013;369(8):711–21. [DOI] [PubMed] [Google Scholar]
- 27.Sands BE, Feagan BG, Rutgeerts P, et al. Effects of vedolizumab induction therapy for patients with Crohn's disease in whom tumor necrosis factor antagonist treatment failed. Gastroenterology 2014;147(3):618–27.e3. [DOI] [PubMed] [Google Scholar]
- 28.Sandborn WJ, Gasink C, Gao LL, et al. Ustekinumab induction and maintenance therapy in refractory Crohn's disease. New Engl J Med 2012;367(16):1519–28. [DOI] [PubMed] [Google Scholar]
- 29.Feagan BG, Sandborn WJ, Gasink C, et al. Ustekinumab as induction and maintenance therapy for Crohn's disease. N Engl J Med 2016;375(20):1946–60. [DOI] [PubMed] [Google Scholar]
- 30.Monteleone G, Neurath MF, Ardizzone S, et al. Mongersen, an oral SMAD7 antisense oligonucleotide, and Crohn's disease. N Engl J Med 2015;372(12):1104–13. [DOI] [PubMed] [Google Scholar]
- 31.Sands BE, Feagan BG, Sandborn WJ, et al. Mongersen (GED-0301) for active Crohn's disease: Results of a phase 3 study. Am J Gastroenterol 2020;115(5):738–45. [DOI] [PubMed] [Google Scholar]
- 32.Sandborn WJ, Feagan BG, Loftus EV, Jr., et al. Efficacy and safety of upadacitinib in a randomized trial of patients with Crohn's disease. Gastroenterology 2020;158(8):2123–38.e8. [DOI] [PubMed] [Google Scholar]
- 33.Feagan BG, Sandborn WJ, D'Haens G, et al. Induction therapy with the selective interleukin-23 inhibitor risankizumab in patients with moderate-to-severe Crohn's disease: A randomised, double-blind, placebo-controlled phase 2 study. Lancet 2017;389(10080):1699–709. [DOI] [PubMed] [Google Scholar]
- 34.Feagan BG, Greenberg GR, Wild G, et al. Treatment of ulcerative colitis with a humanized antibody to the α4β7Integrin. N Engl J Med 2005;352(24):2499–507. [DOI] [PubMed] [Google Scholar]
- 35.Parikh A, Leach T, Wyant T, et al. Vedolizumab for the treatment of active ulcerative colitis: A randomized controlled phase 2 dose-ranging study. Inflamm Bowel Dis 2012;18(8):1470–9. [DOI] [PubMed] [Google Scholar]
- 36.Feagan BG, Rutgeerts P, Sands BE, et al. Vedolizumab as induction and maintenance therapy for ulcerative colitis. N Engl J Med 2013;369(8):699–710. [DOI] [PubMed] [Google Scholar]
- 37.Motoya S, Watanabe K, Ogata H, et al. Vedolizumab in Japanese patients with ulcerative colitis: A phase 3, randomized, double-blind, placebo-controlled study. PLoS One 2019;14(2):e0212989. [DOI] [PMC free article] [PubMed] [Google Scholar]
- 38.Probert CS, Hearing SD, Schreiber S, et al. Infliximab in moderately severe glucocorticoid resistant ulcerative colitis: A randomised controlled trial. Gut 2003;52(7):998–1002. [DOI] [PMC free article] [PubMed] [Google Scholar]
- 39.Rutgeerts P, Sandborn WJ, Feagan BG, et al. Infliximab for induction and maintenance therapy for ulcerative colitis. N Engl J Med 2005;353(23):2462–76. [DOI] [PubMed] [Google Scholar]
- 40.Sandborn WJ, Ghosh S, Panes J, et al. Tofacitinib, an oral Janus kinase inhibitor, in active ulcerative colitis. N Engl J Med 2012;367(7):616–24. [DOI] [PubMed] [Google Scholar]
- 41.Sandborn WJ, Su C, Sands BE, et al. Tofacitinib as induction and maintenance therapy for ulcerative colitis. N Engl J Med 2017;376(18):1723–36. [DOI] [PubMed] [Google Scholar]
- 42.Sandborn WJ, Feagan BG, Marano C, et al. Subcutaneous golimumab induces clinical response and remission in patients with moderate-to-severe ulcerative colitis. Gastroenterology 2014;146(1):85–95. [DOI] [PubMed] [Google Scholar]
- 43.Sandborn WJ, Feagan BG, Wolf DC, et al. Ozanimod induction and maintenance treatment for ulcerative colitis. N Engl J Med 2016;374(18):1754–62. [DOI] [PubMed] [Google Scholar]
- 44.Sandborn WJ, Feagan BG, D'Haens G, et al. Ozanimod as induction and maintenance therapy for ulcerative colitis. N Engl J Med 2021;385(14):1280–91. [DOI] [PubMed] [Google Scholar]
- 45.Sandborn WJ, Ghosh S, Panes J, et al. Efficacy of upadacitinib in a randomized trial of patients with active ulcerative colitis. Gastroenterology 2020;158(8):2139–49.e14. [DOI] [PubMed] [Google Scholar]
- 46.Danese S, Vermeire S, Zhou W, et al. Upadacitinib as induction and maintenance therapy for moderately to severely active ulcerative colitis: Results from three phase 3, multicentre, double-blind, randomised trials. Lancet 2022;399(10341):2113–28. [DOI] [PubMed] [Google Scholar]
- 47.Sandborn WJ, Ferrante M, Bhandari BR, et al. Efficacy and safety of mirikizumab in a randomized phase 2 study of patients with ulcerative colitis. Gastroenterology 2020;158(3):537–49.e10. [DOI] [PubMed] [Google Scholar]
- 48.D'Haens G, Kobayashi T, Morris N, et al. OP26 Efficacy and safety of mirikizumab as induction therapy in patients with moderately to severely active Ulcerative Colitis: Results from the Phase 3 LUCENT-1 study. J Crohn's Colitis 2022;16(Suppl 1):i028–9. [PMC free article] [PubMed] [Google Scholar]
- 49.Vermeire S, O'Byrne S, Keir M, et al. Etrolizumab as induction therapy for ulcerative colitis: A randomised, controlled, phase 2 trial. Lancet 2014;384(9940):309–18. [DOI] [PubMed] [Google Scholar]
- 50.Peyrin-Biroulet L, Hart A, Bossuyt P, et al. Etrolizumab as induction and maintenance therapy for ulcerative colitis in patients previously treated with tumour necrosis factor inhibitors (HICKORY): A phase 3, randomised, controlled trial. Lancet Gastroenterol Hepatol 2022;7(2):128–40. [DOI] [PubMed] [Google Scholar]
- 51.Rubin DT, Dotan I, DuVall A, et al. Etrolizumab versus adalimumab or placebo as induction therapy for moderately to severely active ulcerative colitis (HIBISCUS): Two phase 3 randomised, controlled trials. Lancet Gastroenterol Hepatol 2022;7(1):17–27. [DOI] [PubMed] [Google Scholar]
- 52.Yoshimura N, Watanabe M, Motoya S, et al. Safety and efficacy of AJM300, an oral antagonist of α4 integrin, in induction therapy for patients with active ulcerative colitis. Gastroenterology 2015;149(7):1775–83.e2. [DOI] [PubMed] [Google Scholar]
- 53.Matsuoka K, Watanabe M, Ohmori T, et al. AJM300 (carotegrast methyl), an oral antagonist of α4-integrin, as induction therapy for patients with moderately active ulcerative colitis: A multicentre, randomised, double-blind, placebo-controlled, phase 3 study. Lancet Gastroenterol Hepatol 2022;7(7):648–57. [DOI] [PubMed] [Google Scholar]
- 54.Sandborn WJ, Peyrin-Biroulet L, Zhang J, et al. Efficacy and safety of etrasimod in a phase 2 randomized trial of patients with ulcerative colitis. Gastroenterology 2020;158(3):550–61. [DOI] [PubMed] [Google Scholar]
- 55.Sandborn WJ, Vermeire S, Peyrin-Biroulet L, et al. Etrasimod as induction and maintenance therapy for ulcerative colitis (ELEVATE): Two randomised, double-blind, placebo-controlled, phase 3 studies. Lancet 2023;401(10383):1159–71. [DOI] [PubMed] [Google Scholar]
- 56.Tandon P, Natt N, Malhi G, et al. Clinical remission in paired phase two and three studies in inflammatory bowel disease: A systematic review with meta-analysis. Eur J Gastroenterol Hepatol 2023;35(3):231–40. [DOI] [PubMed] [Google Scholar]
- 57.Sedgwick P. Treatment effects and placebo effects. BMJ 2015;350:h267. [DOI] [PubMed] [Google Scholar]
- 58.Enck P, Bingel U, Schedlowski M, et al. The placebo response in medicine: Minimize, maximize or personalize? Nat Rev Drug Dis 2013;12(3):191–204. [DOI] [PubMed] [Google Scholar]
- 59.Hu A, Kotze PG, Burgevin A, et al. Combination therapy does not improve rate of clinical or endoscopic remission in patients with inflammatory bowel diseases treated with vedolizumab or ustekinumab. Clin Gastroenterol Hepatol 2021;19(7):1366–76.e2. [DOI] [PubMed] [Google Scholar]
- 60.Yzet C, Diouf M, Singh S, et al. No benefit of concomitant immunomodulator therapy on efficacy of biologics that are not tumor necrosis factor antagonists in patients with inflammatory bowel diseases: A meta-analysis. Clin Gastroenterol Hepatol 2021;19(4):668–79.e8. [DOI] [PubMed] [Google Scholar]
- 61.Best WR, Becktel JM, Singleton JW, et al. Development of a Crohn's disease activity index. Gastroenterology 1976;70(3):439–44. [PubMed] [Google Scholar]
- 62.Reinisch W, Sandborn WJ, Hommes DW, et al. Adalimumab for induction of clinical remission in moderately to severely active ulcerative colitis: Results of a randomised controlled trial. Gut 2011;60(6):780–7. [DOI] [PubMed] [Google Scholar]
- 63.Sands BE, Sandborn WJ, Panaccione R, et al. Ustekinumab as induction and maintenance therapy for ulcerative colitis. N Engl J Med 2019;381(13):1201–14. [DOI] [PubMed] [Google Scholar]
- 64.Feagan BG, Danese S, Loftus EV, et al. Filgotinib as induction and maintenance therapy for ulcerative colitis (SELECTION): A phase 2b/3 double-blind, randomised, placebo-controlled trial. Lancet 2021;397(10292):2372–84. [DOI] [PubMed] [Google Scholar]
- 65.Sandborn WJ, Panés J, Danese S, et al. Etrolizumab as induction and maintenance therapy in patients with moderately to severely active Crohn's disease (BERGAMOT): A randomised, placebo-controlled, double-blind, phase 3 trial. Lancet Gastroenterol Hepatol 2023;8(1):43–55. [DOI] [PubMed] [Google Scholar]
- 66.Targan SR, Hanauer SB, van Deventer SJ, et al. A short-term study of chimeric monoclonal antibody cA2 to tumor necrosis factor α for Crohn's disease. N Engl J Med 1997;337(15):1029–36. [DOI] [PubMed] [Google Scholar]
- 67.Rutgeerts P, Van Assche G, Sandborn WJ, et al. Adalimumab induces and maintains mucosal healing in patients with Crohn's disease: Data from the EXTEND trial. Gastroenterology 2012;142(5):1102–11.e2. [DOI] [PubMed] [Google Scholar]