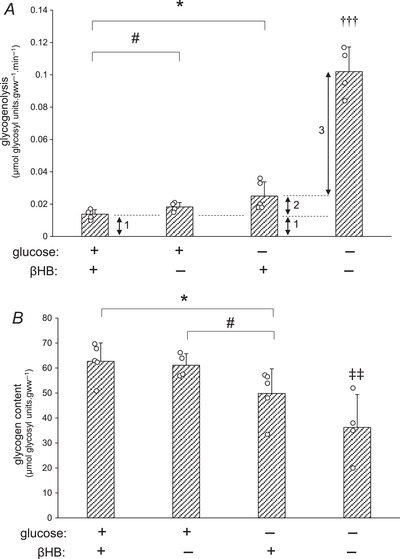
Figure 5. Glycogenolysis and glycogen content in hearts following 3H‐labelling of glycogen.

Rates of glycogenolysis (A) and glycogen content (B) were measured in hearts pre‐loaded with labelled glycogen (high glycogen: HG), which were subsequently perfused with buffer containing 11 mM glucose plus 4 mM βHB, 11 mM glucose alone, 4 mM βHB alone, or substrate‐free buffer, during the subsequent chase. 1: basal glycogenolysis in the presence of ample exogenous substrate, corresponding to basal anaplerosis (Fig. 2: f ′B); 2: additional glycogenolysis in presence of cataplerotic substrate only, corresponding to anaplerosis required for βHB metabolism (Fig. 2: f ′KB); 3: additional glycogenolysis representing glycogen provision for oxidative metabolism (Fig. 2: e′). For further details see text. Values are means ± SD. A, data analysis by ANOVA and Tukey correction: P: +Gluc +βHB vs. +Gluc: 0.047; +Gluc +βHB vs. + βHB: 0.026; +Gluc +βHB vs. no substrate: <0.0001; +Gluc vs. +βHB: 0.187; +Gluc vs. no substrate: <0.0001; +βHB vs. no substrate: <0.0001. B, data analysis by ANOVA and Tukey correction: P: +Gluc +βHB vs. +Gluc: 0.720; +Gluc +βHB vs. + βHB: 0.047; +Gluc +βHB vs. no substrate: 0.009; +Gluc vs. +βHB: 0.037; +Gluc vs. no substrate: 0.009; +βHB vs. no substrate: 0.151. Effect of glucose is indicated as: *P < 0.05. Effect of βHB is indicated as: # P < 0.05. Difference between substrate‐free perfusion (−Gluc −βHB) and substrate‐containing perfusions is indicated as: ††† P < 0.001. Difference between substrate‐free perfusion (−Gluc −βHB) and glucose‐containing perfusions is indicated as: ‡‡ P < 0.01. Significance was taken at P < 0.05. βHB, d‐β‐hydroxybutyrate.
