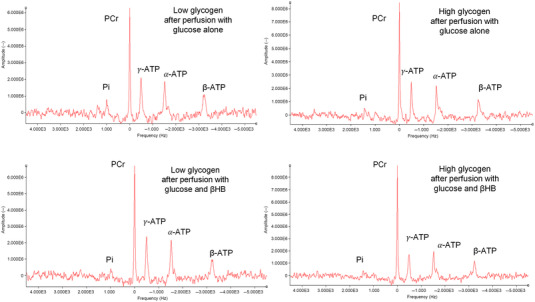
Figure 7. Examples of 31P‐NMR spectra acquired in hearts with high or low glycogen perfused with either 11 mM glucose alone or 11 mM glucose plus 4 mM βHB (n = 10 per group; see text for further details).

The phosphocreatine (PCr) resonance frequency was set at 0 Hz. βHB, d‐β‐hydroxybutyrate. [Colour figure can be viewed at wileyonlinelibrary.com]
