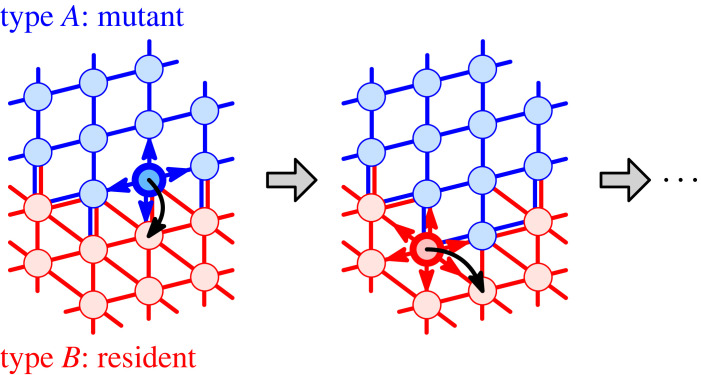
Figure 2.
Moran process with type-dependent dispersal patterns. In each discrete time step, a random individual reproduces and the offspring proliferates to a neighbouring node. Type A offspring (mutant, blue) migrate along the edges of the blue graph GA, whereas type B offspring (residents, red) migrate along the red edges of GB. The key quantity is the fixation probability ρ(GA, GB) that a single initial mutant successfully invades the population of residents.

