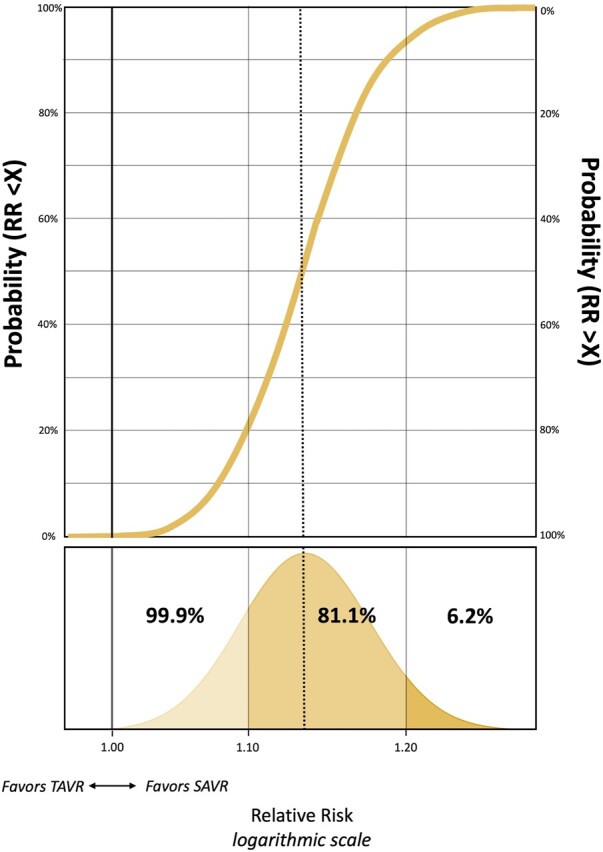
Figure 3:

Full posterior probability distribution of a 5-year actuarial all-cause mortality difference in favour of SAVR under a vague prior in grid a plot. The golden curve represents the posterior probability at various RR thresholds, as reflected by the Bell curve in the lower part of the figure. RR: relative risk; SAVR: surgical aortic valve replacement; TAVR: transcatheter aortic valve replacement.
