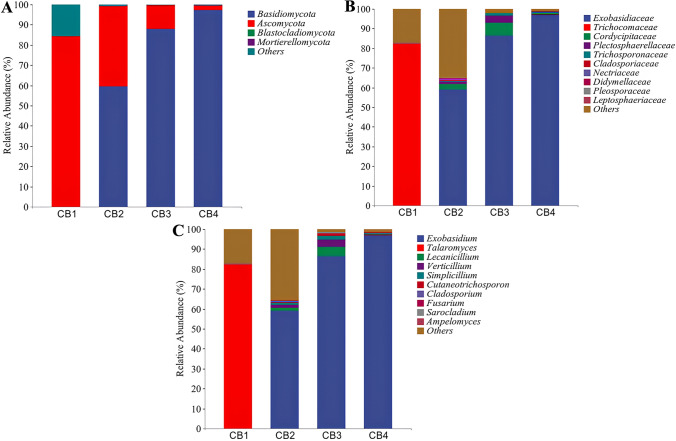
Fig. 2.
In the graph, the horizontal coordinate is the relative abundance of endophytic bacteria at the phylum, family, and genus levels affected by blister blight disease at different stages (early, middle, and late) of disease progression as well as healthy ones, and the vertical coordinate is the relative abundance of each taxon at a specific classification level. A Relative abundance of endophytic fungi at the phylum level; B Relative abundance of endophytic fungi at the family level; and C Relative abundance of endophytic fungi at the genus level

