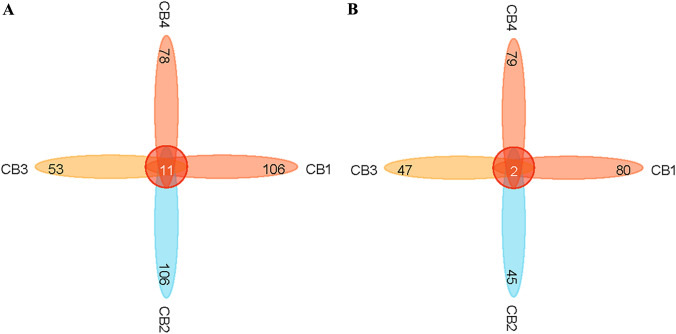
Fig. 6.
ASV level of endophytic bacteria distribution in tea leaves affected by blister blight disease at different stages (early, middle, and late) of disease progression as well as healthy ones. In the diagram, each block represents a group, the overlapping area between the blocks indicates the ASV shared between the corresponding groups, and the number of each block indicates the number of ASVs contained in that block. A Venn diagram shows the number of ASVs shared and unique fungi species; B Venn diagram shows the number of ASVs shared and unique bacterial species

