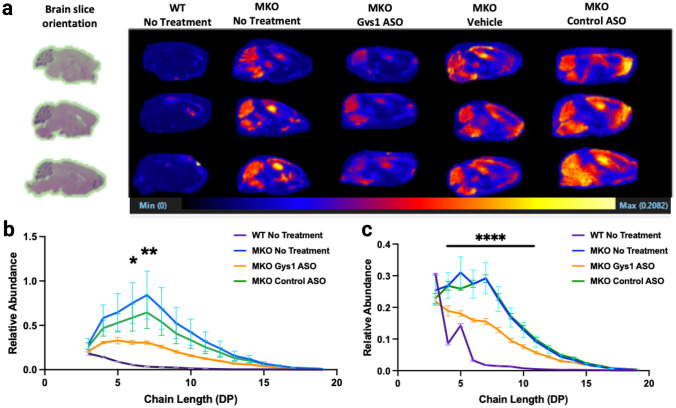
Fig. 4.
MALDI imaging of glycogen accumulation in mice. a Left, H&E staining of WT mouse brain reflecting the orientation for all the brains analyzed via MALDI. Right, MALDI imaging displaying regional and relative abundance of glycogen in WT and MKO mouse brain sagittal sections. Glycogen in this image was assessed by quantifying linear glucose chains that are 7 sugar monomers long. b Quantification of MALDI imaging in the hippocampus. The relative abundance of each glucose polymer from triose through DP19 (i.e. 19 glucose unit chain) was determined in the hippocampus from each cohort of mice (N = 3). The asterisks indicate there is a significant difference between the MKO Gys1 ASO-treated group and the MKO group with no treatment. c Similar analysis as b was also performed on the cerebellum (N = 3). Significance was determined using a one-way ANOVA with post hoc Tukey test for multiple comparisons between the MKO Gys1 ASO group and the MKO group with no treatment, where *P < 0.05, **P < 0.01, and ****P < 0.0001

