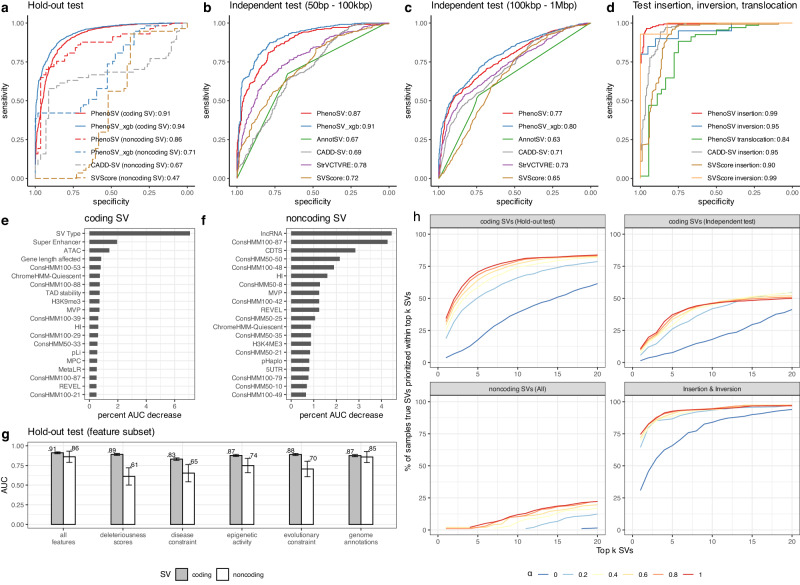
Fig. 3. Evaluation of the performance of PhenoSV and feature importance for coding and noncoding SVs.
a Model AUCs in the hold-out test dataset for coding SVs (n = 1385 pathogenic and n = 1174 benign SVs, solid lines) and noncoding SVs (n = 57 pathogenic and n = 57 benign SVs, dashed lines). b, c Model AUCs in the independent test datasets of small coding SVs (n = 383 pathogenic and n = 366 benign SVs) with sizes ranging from 50 bp to 100 kbp and large coding SVs (n = 1208 pathogenic and 801 benign SVs) with sizes ranging from 100 kbp to 1 Mbp. d Model AUCs in the test datasets of insertions (n = 175 pathogenic SVs and n = 175 benign SVs), inversions (n = 20 pathogenic SVs and n = 20 benign SVs), and translocations (n = 68 pathogenic fusion transcripts and n = 38 benign fusion transcripts). e, f PhenoSV feature importance measured by percent AUC decrease in the hold-out test dataset for coding and noncoding SVs. g PhenoSV AUCs in the hold-out test dataset for coding and noncoding SVs trained with all 238 features or only a subset of features belonging to the same category (x axis). Error bars represent 95% CI. h PhenoSV performance in prioritizing phenotype-related SVs. Displayed are percentage of samples that the true disease-related SV is prioritized (y-axis) within top k (x-axis) out of about 19,000 SVs. controls for the contributions of phenotype information in prioritization. True disease-related SVs are from coding SVs in hold-out test set (top left panel), coding SVs in independent test set (top right panel), all noncoding SVs (bottom left panel), and SVs of insertion and inversion (bottom right panel). All SVs in (a–c) and (e–g) are deletions or duplications. Source data are provided as a Source Data file.

