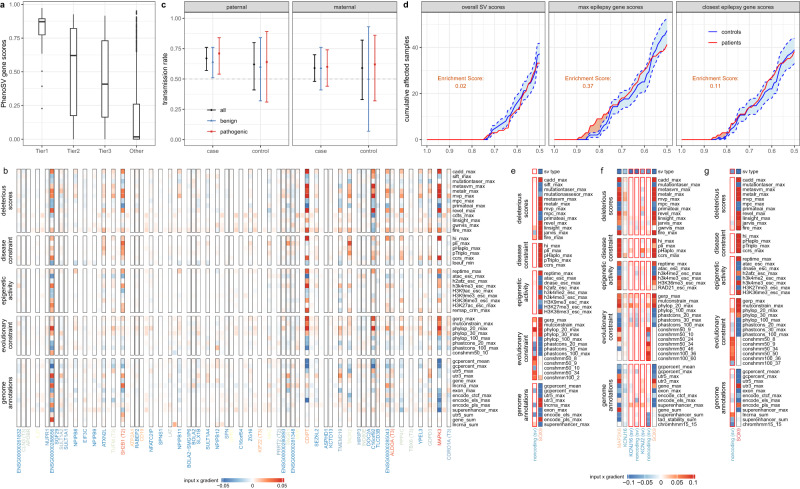
Fig. 4. Evaluation of the performance of PhenoSV in identifying phenotype-related genes affected by SVs.
a Boxplot of scores (y-axis, ) in four groups of driver genes affected by 91 coding SVs predicted by the original study on congenital abnormality (x-axis). Median (center line), IQR (box limits), and outliers (points) that exceeding 1.5x IQR were shown in the boxplot. b Displayed are input × gradient values of top 50 important features (row) for each genome segment (column) of the SV (chr16:28473235-30186830, deletion, GRCh38), including protein-coding genes segments (black borders) and intergenic noncoding segments (no borders). Colors of column names represent values of ranging from 0 (blue) to 1 (red) with . c Transmission rate of paternal (case: n = 100, control: n = 26, left panel) and maternal (case: n = 79, control: n = 17, right panel) noncoding SVs to cases and controls with (blue and red) and without (black) being stratified by . Error bars represent 95% CI of transmission rate, where the center is observed transmission rate. d Displayed are cumulative affected sample numbers (y-axis) with (left panel), of the most affected epilepsy gene (middle panel), and of the nearest epilepsy gene (right panel) larger than given thresholds (x-axis) of 150 patients and 150 controls on average. Confidence intervals of controls (blue shade area between dashed lines) are calculated by randomly sampling 150 samples from 223 controls for 100 times. Area of orange shades represent enrichment score, defined as integrated cumulative number of affected patient samples over upper bound of the 95% confidence interval of controls. e–g Displayed are input × gradient values of top 50 important features (row) for each genome segment of the SVs affecting SOX9 gene (e: Gordon et al.59, GRCh38, chr17:70685120-70964563, deletion; f: Kurth et al.60, GRCh38, chr17:70134929-71339950, duplication; g: Benko et al.61, GRCh38, chr17:71072938-71767918, duplication). Genome segments (column) include SV segments (red borders) and distal genes within TAD (no borders). Colors of column names represent values of ranging from 0 (blue) to 1 (red). Source data are provided as a Source Data file.

