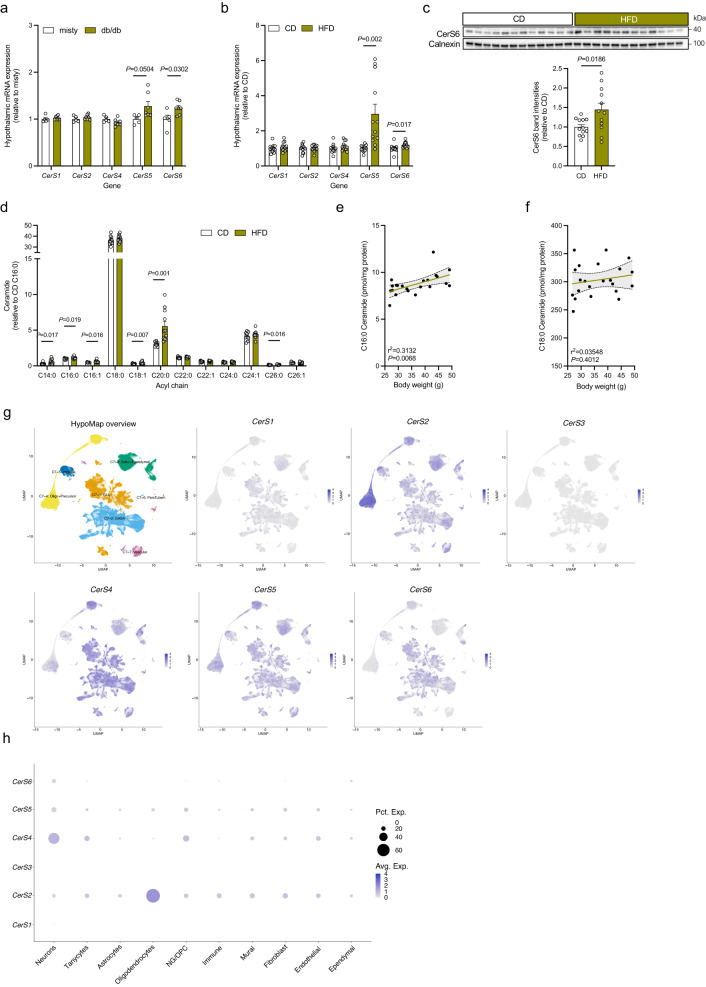
Fig. 1. Hypothalamic CerS6 expression and C16:0 ceramide levels are increased in mouse models of obesity and diabetes.
a, b Relative mRNA expression of the ceramide synthase (CerS) genes in hypothalamus samples of misty and db/db male mice (a n = 5 vs. 7 mice), and C57BL/6 N male mice fed a control diet (CD) or high-fat diet (HFD) for 16 weeks (b n = 12 vs. 12 mice). c Immunoblot and densitometric analysis of CerS6 in hypothalamus lysates of CD- and HFD-fed mice (n = 12 vs. 12 mice). CerS6 band intensities normalized to Calnexin; values expressed relative to CD. Uncropped blots in Source Data. d Ceramide levels in the hypothalamus of CD- and HFD-fed mice (n = 11 vs. 11 mice) relative to the C16:0 ceramide content in CD-fed mice. e, f Linear regression model of the hypothalamic content of C16:0 ceramide (e) and C18:0 ceramide (f) plotted against the body weight of CD- and HFD-fed mice (n = 22 mice). Dotted lines indicate the 95% confidence interval; r2 denotes the coefficient of determination. g Uniform Manifold Approximation and Projection (UMAP) plots of single-cell sequencing data according to HypoMap. HypoMap overview is colored by major cell types, with the orange-colored cluster depicting GLUtamatergic neurons and the light blue-colored cluster depicting GABAergic neurons. Corresponding UMAP plots are colored by log-normalized gene expression of CerS1-6. h Dot plots displaying relative expression of CerS1-6 in major cell types according to single-cell sequencing results harmonized in HypoMap. Data in a–d are represented as mean values ± SEM, including data points of individual mice entering the analysis. P-values calculated using two-tailed unpaired Student’s t-test (a–d) or simple linear regression modeling (e, f). Source data and further details of statistical analyses are provided as a Source Data file.

