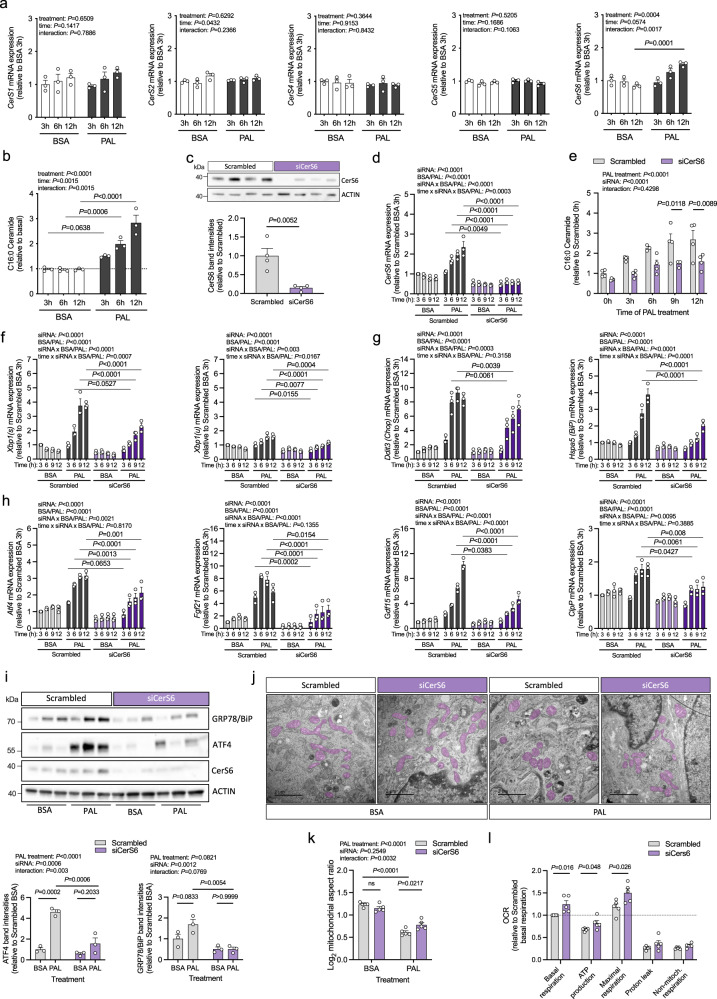
Fig. 2. Inhibition of CerS6-dependent ceramide synthesis in hypothalamic neurons attenuates palmitate-induced ER/mitochondrial stress and mitochondrial fragmentation.
a Relative mRNA expression of CerS1-6 in N43/5 cells following palmitate (PAL, black) or BSA treatment (BSA, white) for the time indicated in hours (h) (n = 3 independent experiments). b C16:0 ceramide levels relative to the C16:0 ceramide content in untreated cells (basal, dotted line) (n = 3 independent experiments). c Immunoblot analysis of CerS6, 57 h after transfection with an siRNA targeting CerS6 (siCerS6, purple) or scrambled control (Scrambled, gray). CerS6 band intensities normalized to ACTIN; values expressed as relative to control (n = 4 independent experiments). Uncropped blots in Source Data. d Relative mRNA expression of CerS6 in siRNA-treated cells incubated with BSA or PAL for the time indicated (n = 3 independent experiments). e Relative C16:0 ceramide levels in siRNA-treated cells after incubation with PAL for the time indicated (n = 4 independent experiments; n = 3 for Scrambled 6 h). f–h Relative mRNA expression of spliced Xbp1 (Xbp1(s)) and unspliced Xbp1 (Xbp1(u)) (f), the ER stress markers Ddit3 and Hspa5 (g), and the mitochondrial stress markers Atf4, Fgf21, Gdf15, and ClpP (h) in siRNA-treated cells incubated with BSA or PAL for the time indicated (n = 3 independent experiments). i Immunoblot analysis of ATF4 (left quantification), GRP78/BiP (right quantification), and CerS6 in siRNA-treated cells incubated with BSA or PAL for 9 h. Band intensities normalized to ACTIN; values expressed as relative to BSA-treated scrambled control (n = 3 independent cultures). Uncropped blots in Source Data. j TEM images of siRNA-treated cells incubated with BSA or PAL for 9 h (mitochondria are highlighted in purple, scale bars: 2 µm). k Quantification of log2-transformed mitochondrial aspect ratios from TEM images as represented in (j) (n = 5 independent experiments; aspect ratios from a minimum of 10 cells/group/experiment). l Mitochondrial oxygen consumption rates (OCR) in siRNA-treated N43/5 cells incubated with PAL for 9 h (n = 5 independent experiments with 46 technical replicates per run). Data represented as mean values of n independent experiments ±SEM. Individual data points in (d, f–h) represent the average of three replicate culture dishes per experiment. P-values calculated using two-tailed unpaired Student’s t-test (c, l), two-way ANOVA and Bonferroni’s (a, b, e) or Tukey’s multiple comparison test (i, k), or three-way ANOVA and Tukey’s multiple comparison test (d, f–h). Source data and further details of statistical analyses are provided as a Source Data file.

