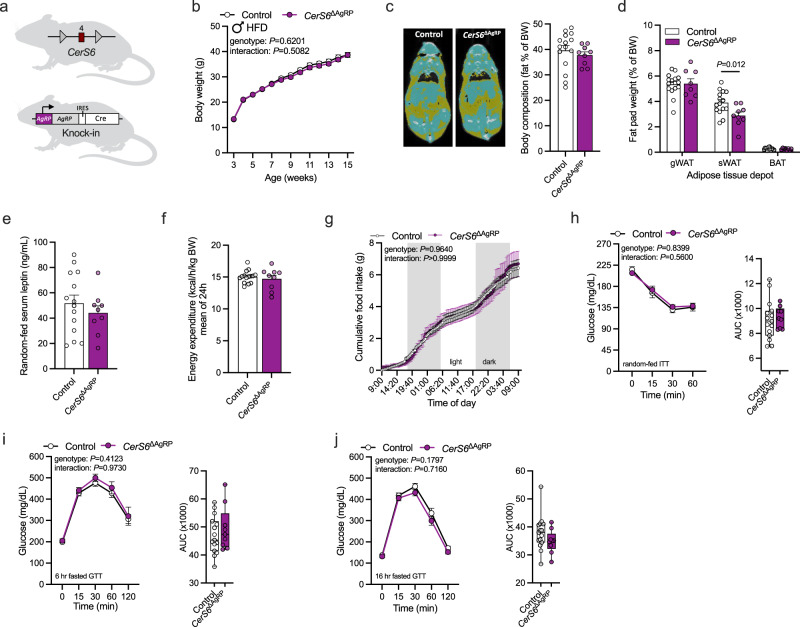
Fig. 5. Depletion of CerS6 in AgRP neurons does not affect glucose and energy metabolism in HFD-fed male mice.
a CerS6fl/fl mice (top) in which exon 4 of CerS6 (red square) is flanked by loxP sites (gray triangles) were bred to mice expressing Cre from the endogenous AgRP locus (right). The Internal Ribosome Entry Side (IRES) is used to ensure bicistronic expression of AgRP and Cre. AgRP-Cre-positive CerS6fl/fl mice (CerS6ΔAgRP, purple) and Cre-negative CerS6fl/fl control littermates (Control, white) were used for analysis. b Body weight development of mice during HFD feeding (n = 15 vs. 9 mice/week). c CT scans (yellow, fat tissue; blue, non-adipose soft tissue) and body fat content relative to body weight (n = 15 vs. 9 mice). d Fat-pad weights of gonadal white adipose tissue (gWAT; n = 15 vs. 8 mice), subcutaneous WAT (sWAT; n = 15 vs. 9 mice), and brown adipose tissue (BAT; n = 15 vs. 8 mice) relative to body weight. e Serum leptin levels of random-fed mice (n = 14 vs. 9 mice). f Average energy expenditure over 24 h normalized for body weight (n = 15 vs. 9 mice). g Cumulative food intake over 48 h (n = 15 vs. 9 mice; gray background indicates dark phase). h Insulin tolerance test and area under the curve (AUC) for each mouse (n = 15 vs. 9 mice). i, j Glucose tolerance test following a 6 h (i) or 16 h (j) fasting period and AUCs (n = 15 vs. 9 mice). All data obtained from male mice. Data in (b–g) and longitudinal data in (h–j) are represented as mean values ± SEM. Boxplots indicate median ±min/max and include data points of individual mice entering the analysis. P-values calculated using two-tailed unpaired Student’s t-test (d) or two-way RM ANOVA (longitudinal analysis in b, g–j). Source data and further details of statistical analyses are provided as a Source Data file. Illustration in (a) created with BioRender.com.

