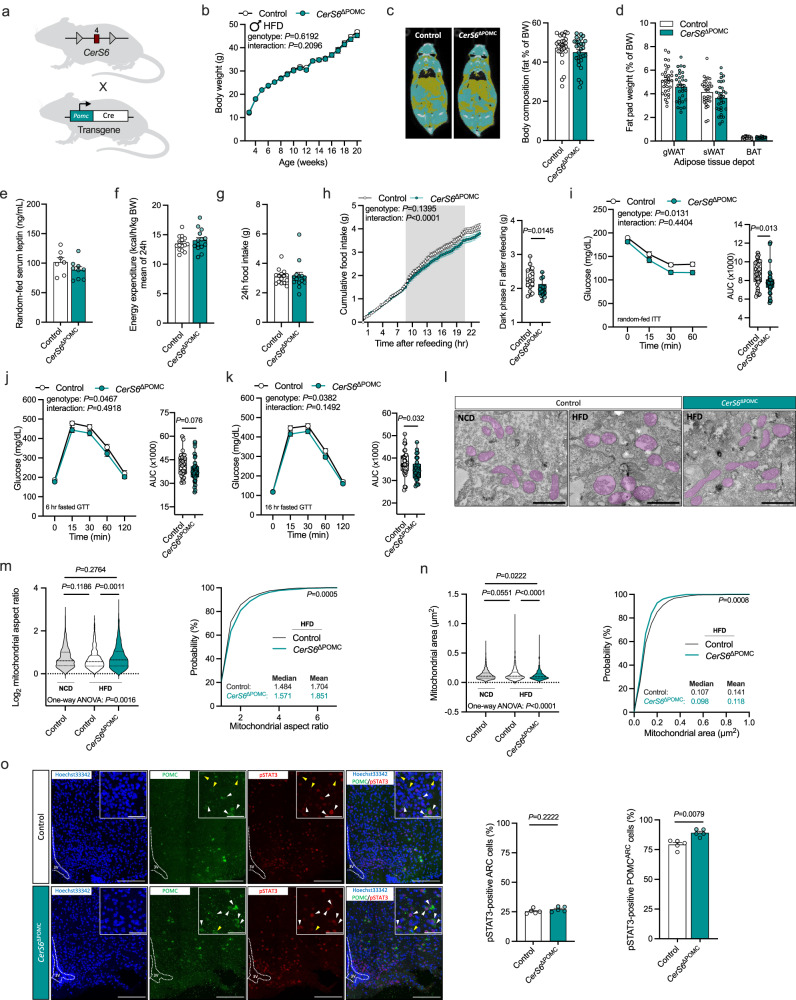
Fig. 6. Depletion of CerS6 in POMC neurons affects mitochondrial morphology, feeding behavior, and glucose metabolism in HFD-fed male mice.
a CerS6fl/fl mice in which exon 4 of CerS6 (red square) is flanked by loxP sites (gray triangles) were bred to mice with transgenic Cre expression under control of the POMC promoter (green). POMC-Cre-positive CerS6fl/fl mice (CerS6ΔPOMC, green) and Cre-negative CerS6fl/fl control littermates (Control, white) were used for analysis. b Body weight development of mice during HFD feeding (n = 17–32 vs.16–33 mice/week). c CT scans (yellow, fat tissue; blue, non-adipose soft tissue) and body fat content relative to body weight (n = 27 vs. 28 mice). d Fat-pad weights of gonadal white adipose tissue (gWAT, n = 31 vs. 32 mice), subcutaneous WAT (sWAT, n = 31 vs. 32 mice), and brown adipose tissue (BAT, n = 26 vs. 27 mice) relative to body weight. e Serum leptin levels of random-fed mice (n = 7 vs. 9 mice). f Average energy expenditure over 24 h normalized for body weight (n = 15 vs 14 mice). g Food intake over 24 h (n = 15 vs. 14 mice). h Cumulative food intake after refeeding following a 16-h fasting period (gray background indicates dark phase) and absolute dark phase food intake (FI) after refeeding (n = 15 vs.14 mice). i Insulin tolerance test and area under the curve (AUC) for each mouse (n = 32 vs. 32 mice). j, k Glucose tolerance test following a 6 h (j) or 16 h (k) fasting period and AUCs (n = 32 vs. 33 mice). l Transmission electron micrographs of mitochondria in ARC POMC neurons of control male mice fed a normal chow (NCD, left) or HFD (middle) for 8 weeks, and HFD-fed CerS6ΔPOMC mice (right; mitochondria are highlighted in purple; scale bars: 1 µm; acquired images were quantified in m, n). m Violin plots of log2-transformed mitochondrial aspect ratios (left) and cumulative distribution function (probability plot) of mitochondrial aspect ratios in HFD-fed mice (right) quantified from TEM images as represented in l (Control NCD: n = 793, Control HFD: n = 1010, CerS6ΔPOMC HFD: n = 737 mitochondria from 3-6 POMC neurons/mouse, 3 mice/group). n Violin plots (left) and probability plots (right) of mitochondrial area in HFD-fed mice quantified from TEM images as represented in l (Control NCD: n = 793, Control HFD: n = 1010, CerS6ΔPOMC HFD: n = 737 mitochondria from 3-6 POMC neurons/mouse, 3 mice/group). o Left: Confocal images of POMC (green) and pSTAT3 (red) immunoreactivity in coronal ARC brain sections of 16-h fasted HFD-fed controls (top) and CerS6ΔPOMC mice (bottom), 45 min after injection of leptin (6 mg/kg ip; white arrows indicate cells positive for POMC and pSTAT3, yellow arrows indicate cells positive for POMC and negative for pSTAT3; scale bars: 150 µm for overview images and 50 µm for zoom images; blue staining depicts nuclei stained by Hoechst33342). Right: quantification of pSTAT3-positive cells in the ARC relative to all imaged ARC cells (left) or pSTAT3/POMC-positive cells relative to all imaged POMC-positive cells in the ARC (right; n = 5 vs. 5 mice). All data obtained from male mice. Data in (b–g, o) and longitudinal data in (h–k) are represented as mean values ± SEM. Boxplots indicate median ±min/max and include data points of individual mice entering the analysis. Dashed lines in the violin plots indicate median and dotted lines indicate the first and third quartile, respectively. P-values calculated using two-tailed unpaired Student’s t-test (dark phase FI in h, AUC in i–k), two-tailed Wilcoxon–Mann–Whitney test (o), one-way ANOVA followed by Tukey’s multiple comparison test (m, n), Kolmogorov–Smirnov test (distributions in m, n), two-way RM ANOVA (longitudinal analysis in h, i–k), or a mixed-effects model (b). Source data and further details of statistical analyses are provided as a Source Data file. Illustration in (a) created with BioRender.com.

