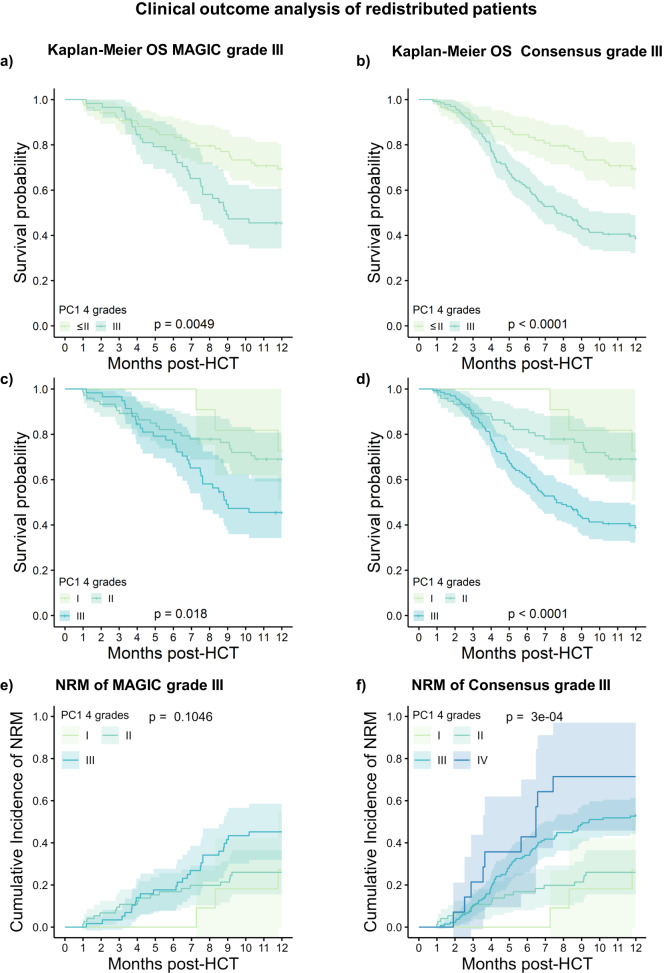
Fig. 7. Clinical outcome analysis of re-distributed patients between data-driven and conventional grading systems.
Redistributed patients from one severity category to another between different grading systems are compared to the remaining patients in the original category. a Kaplan–Meier OS curves with 95% CI of redistributed patients from MAGIC grade III to PC1-grade ≤II (light green) compared to intersection grade III patients in both grades (dark green). Strata are compared with the two-sided log-rank test. The phenotypes are detailed in Supplementary Data 8. b Comparison of Kaplan-Meier OS curves with 95% CI of redistributed patients from Consensus grade III to PC1-grade ≤ II (light green) to intersection of grade III patients in both consensus and PC1 (dark-green). Strata are compared with the two-sided log-rank test. c Kaplan–Meier OS curves with 95% CI of redistributed patients from MAGIC grade III to PC1-grade I (light green) and PC1-grade II (green) are compared to grade III patients in both MAGIC and PC1 (blue-green). d Kaplan–Meier OS curves with 95% CI of redistributed patients from Consensus grade III to PC1-grade I (light green), to PC1-grade II (green) are compared to the intersection of grade III patients (blue-green). e Cumulative incidence curves of NRM are compared for the same strata as in c. Error bands show 95% CI. f Cumulative incidence curves of NRM are compared for redistributed Consensus grade III patients to PC1 including PC1-grade IV (dark blue). Error bands show 95% CI. Strata for NRM are compared with the two-sided Gray test.

