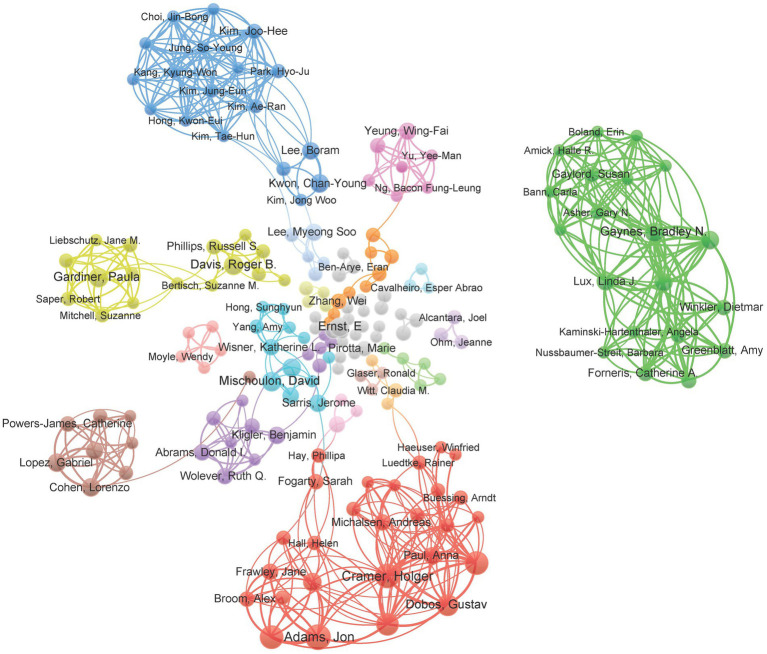
Figure 5.
Mapping of the co-authorship analysis among the authors who published at least three papers on research regarding managing depression with CAM. Each node represents an institution, and the node size indicates the number of publications. The connection between the nodes represents a co-authorship relationship, and the thickness of the lines indicates strength (weights on the total link strength).

