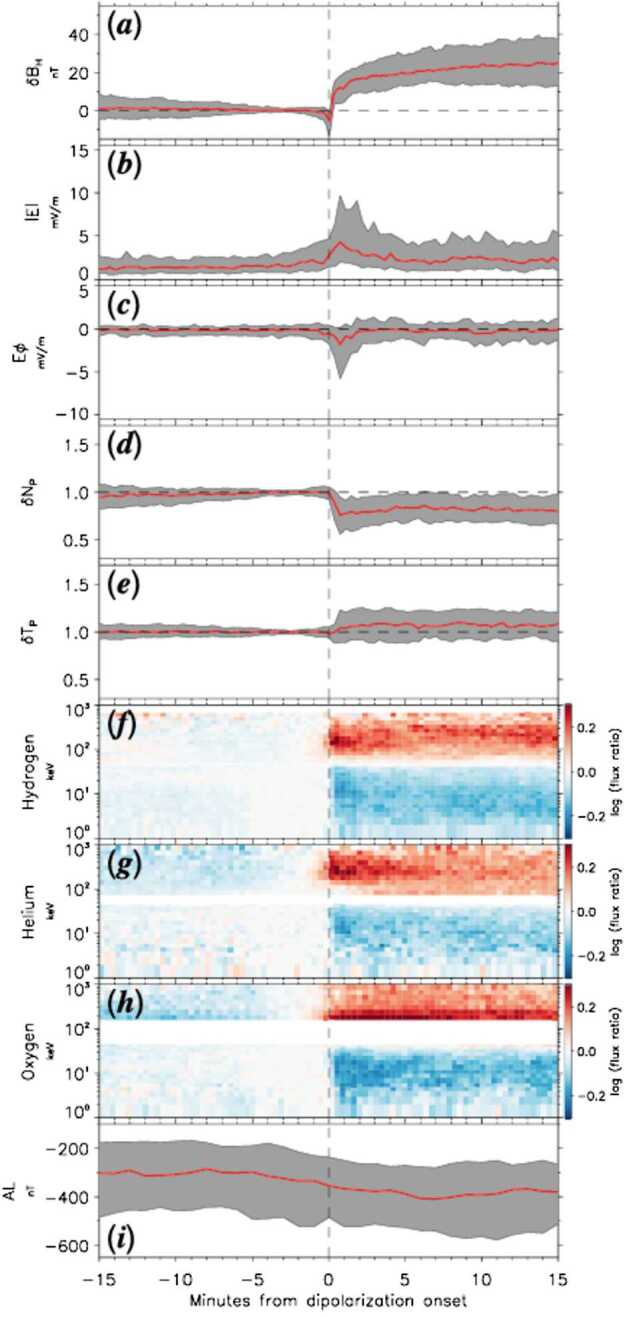
Fig. 15.

Superposed epoch results of Van Allen Probes measurements for the 144 dipolarization events. From top to bottom, (a) BH variations (BH), (b) total electric field strength (|E|), (c) the azimuthal component of electric field (E, positive eastward), (d) normalized proton number density (), and (e) temperature (TP) variations, (f) hydrogen, (g) helium, and (h) oxygen ion flux ratios around 90° pitch angle to the corresponding pre-onset levels, and (i) AL index. The red trace and gray shading area in Fig. 15a–15e and 15i are the median value and interquartile range of these parameters, respectively. The red (blue) color code in Fig. 15f–15h represents the relative flux increase (decrease) to the pre-onset level, given on a logarithmic scale (from Motoba et al. 2018)
