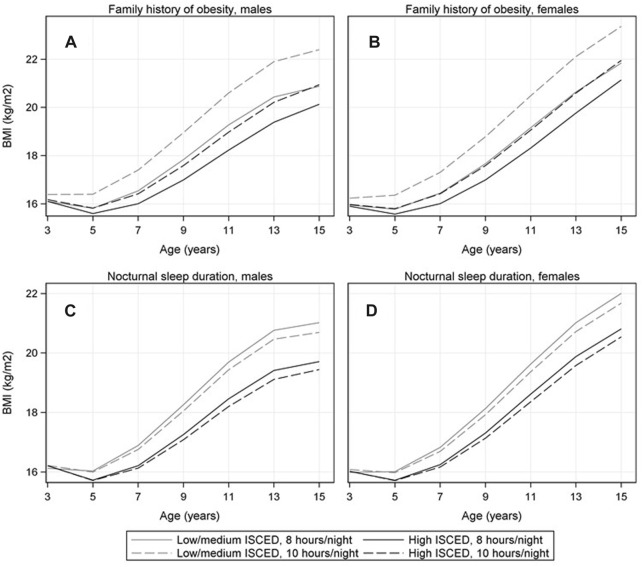
FIGURE 3.
Mean BMI trajectories comparing children with vs. without family history of obesity [panel (A) in males, panel (B) in females] and BMI trajectories comparing children that sleep 8 vs. 10 h/night [panel (C) in males; panel (D) in females] stratified by educational level of parents (low/medium vs. high ISCED level). The numbers represent the marginal means estimated based on the confounder-adjusted fractional polynomial mixed effects models, i.e., the mean values at fixed exposure levels were standardized over covariates (IDEFICS/I.Family study, eight European countries, 2007–2014).

