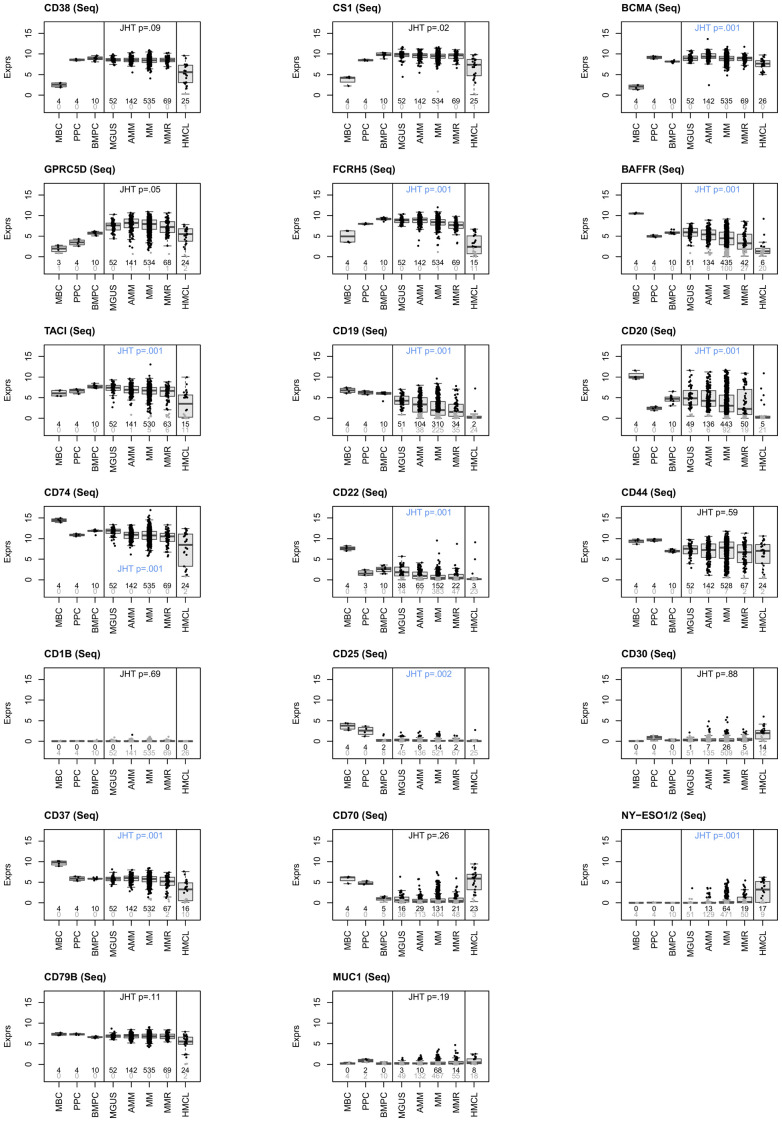
Figure 1.
RNA-sequencing based assessment of immune-oncological actionable targets depicted in Figure 4. Expression height in malignant plasma cells from MGUS-, asymptomatic (AMM), symptomatic (MM) and relapsed myeloma patients (MMR) in comparison to normal bone marrow plasma cells (BMPC), memory B-cells (MBC), proliferating plasmablasts (PPC) and human myeloma cell lines (HMCL). Targets can be divided in those expressed in all normal and (almost all, >99%) malignant plasma cells (n=10; CD38, SLAMF7 (CS1), BCMA, GPRC5D, FCRH5, TACI, CD74, CD44, CD37 and CD79B), those constitutively expressed in all normal plasma cells with expression lost in a subfraction of malignant plasma cells (n=4; BAFF-R [81.3%], CD19 [57.9%], CD20 [82.8%], CD22 [28.4%]), and targets aberrantly expressed in malignant plasma cells, i.e., not expressed in BMPC, (n=3; NY-ESO1/2 [12%], MUC1 [12.7%], CD30 [4.9%]). Some suggested targets are not expressed (CD1B) or at a very low level in normal and malignant plasma cells (CD25 [2.6%]). Black and grey color of data points and corresponding numbers indicate “presence” and “absence” of expression, respectively. See Table 2 for numerical depiction and details. “Present” expression by RNA-sequencing is defined as presence of at least one read count per million (CPM) per 1000 bp. Gene length is defined as median transcript length. Significant difference for higher (all other genes)- or lower expression (MUC1, NY-ESO1) of genes from MGUS to AMM to MM to MMR is assessed by Jonckheere-Terpstra Test (JHT). Exploratory P-values given. P-Values remaining significant after Benjamini-Hochberg adjustment for multiple testing are depicted in blue color. Note: part of expression data for BCMA and CD38 have previously been published (39, 58). For a comparison from AMM to MM to MMR, see Supplementary Figure S2.

