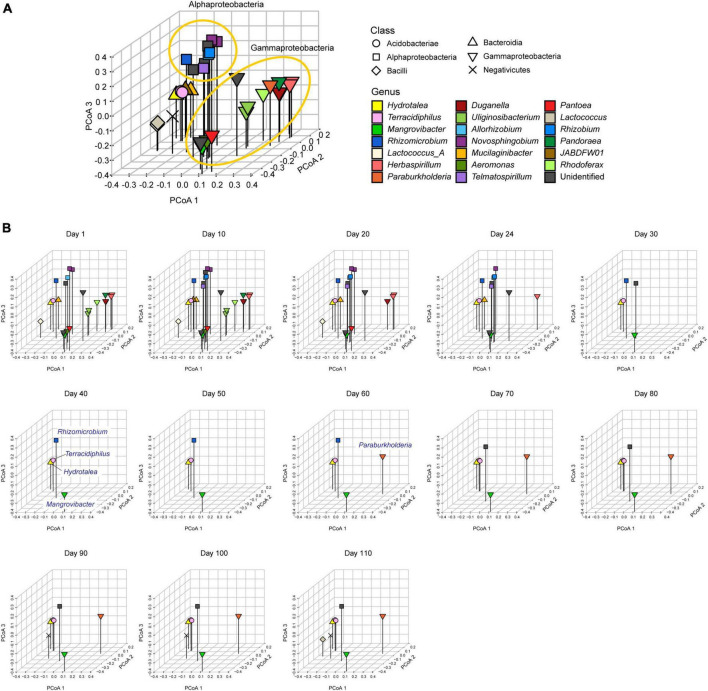
FIGURE 3.
Metagenomic niche space. (A) Distributions of MAGs within metagenomic niche space. Based on dissimilarity in gene repertoires, microbial MAGs that appeared in the time-series of the target microcosm were plotted on the three-dimensional space defined by the principal coordinate analysis (PCoA) of 6,999 genes. (B) Changes in the distributions of microbial MAGs within niche space. At each time point, detected MAGs (relative abundance >0.1%) were plotted on the space defined in the multivariate analysis in the in the panel (A).

