FIGURE 4.
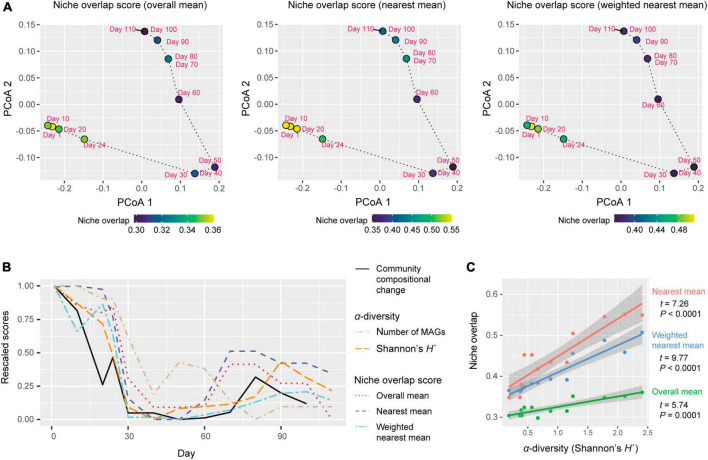
Dynamics of niche-overlap level. (A) Community-level profiles of metabolic pathways/processes and niche overlap index. The niche overlap indices were defined based on the Jaccard similarity/dissimilarity of gene compositions between pairs of the microbial MAGs detected at a target time point. Three types of niche overlap indices are shown on a PCoA surface representing community-level compositions of genes. On the PCoA surface, time points are distributed based on the sum of the gene repertoires of the detected MAGs. (B) Dynamics of niche-overlap levels. Niche overlap scores are shown across the time-series. The magnitude of community compositional changes (Bray–Curtis β-diversity between present and next time points through the time-series of the shotgun metagenomic data) and α-diversity indices of the communities are shown as well. The values of each index were rescaled between 0 (minimum through the time series) to 1 (maximum through the time series) through the time series. (C) Relationship between α-diversity and niche overlap scores. The lines represent linear regressions (with 95% confidence intervals).

