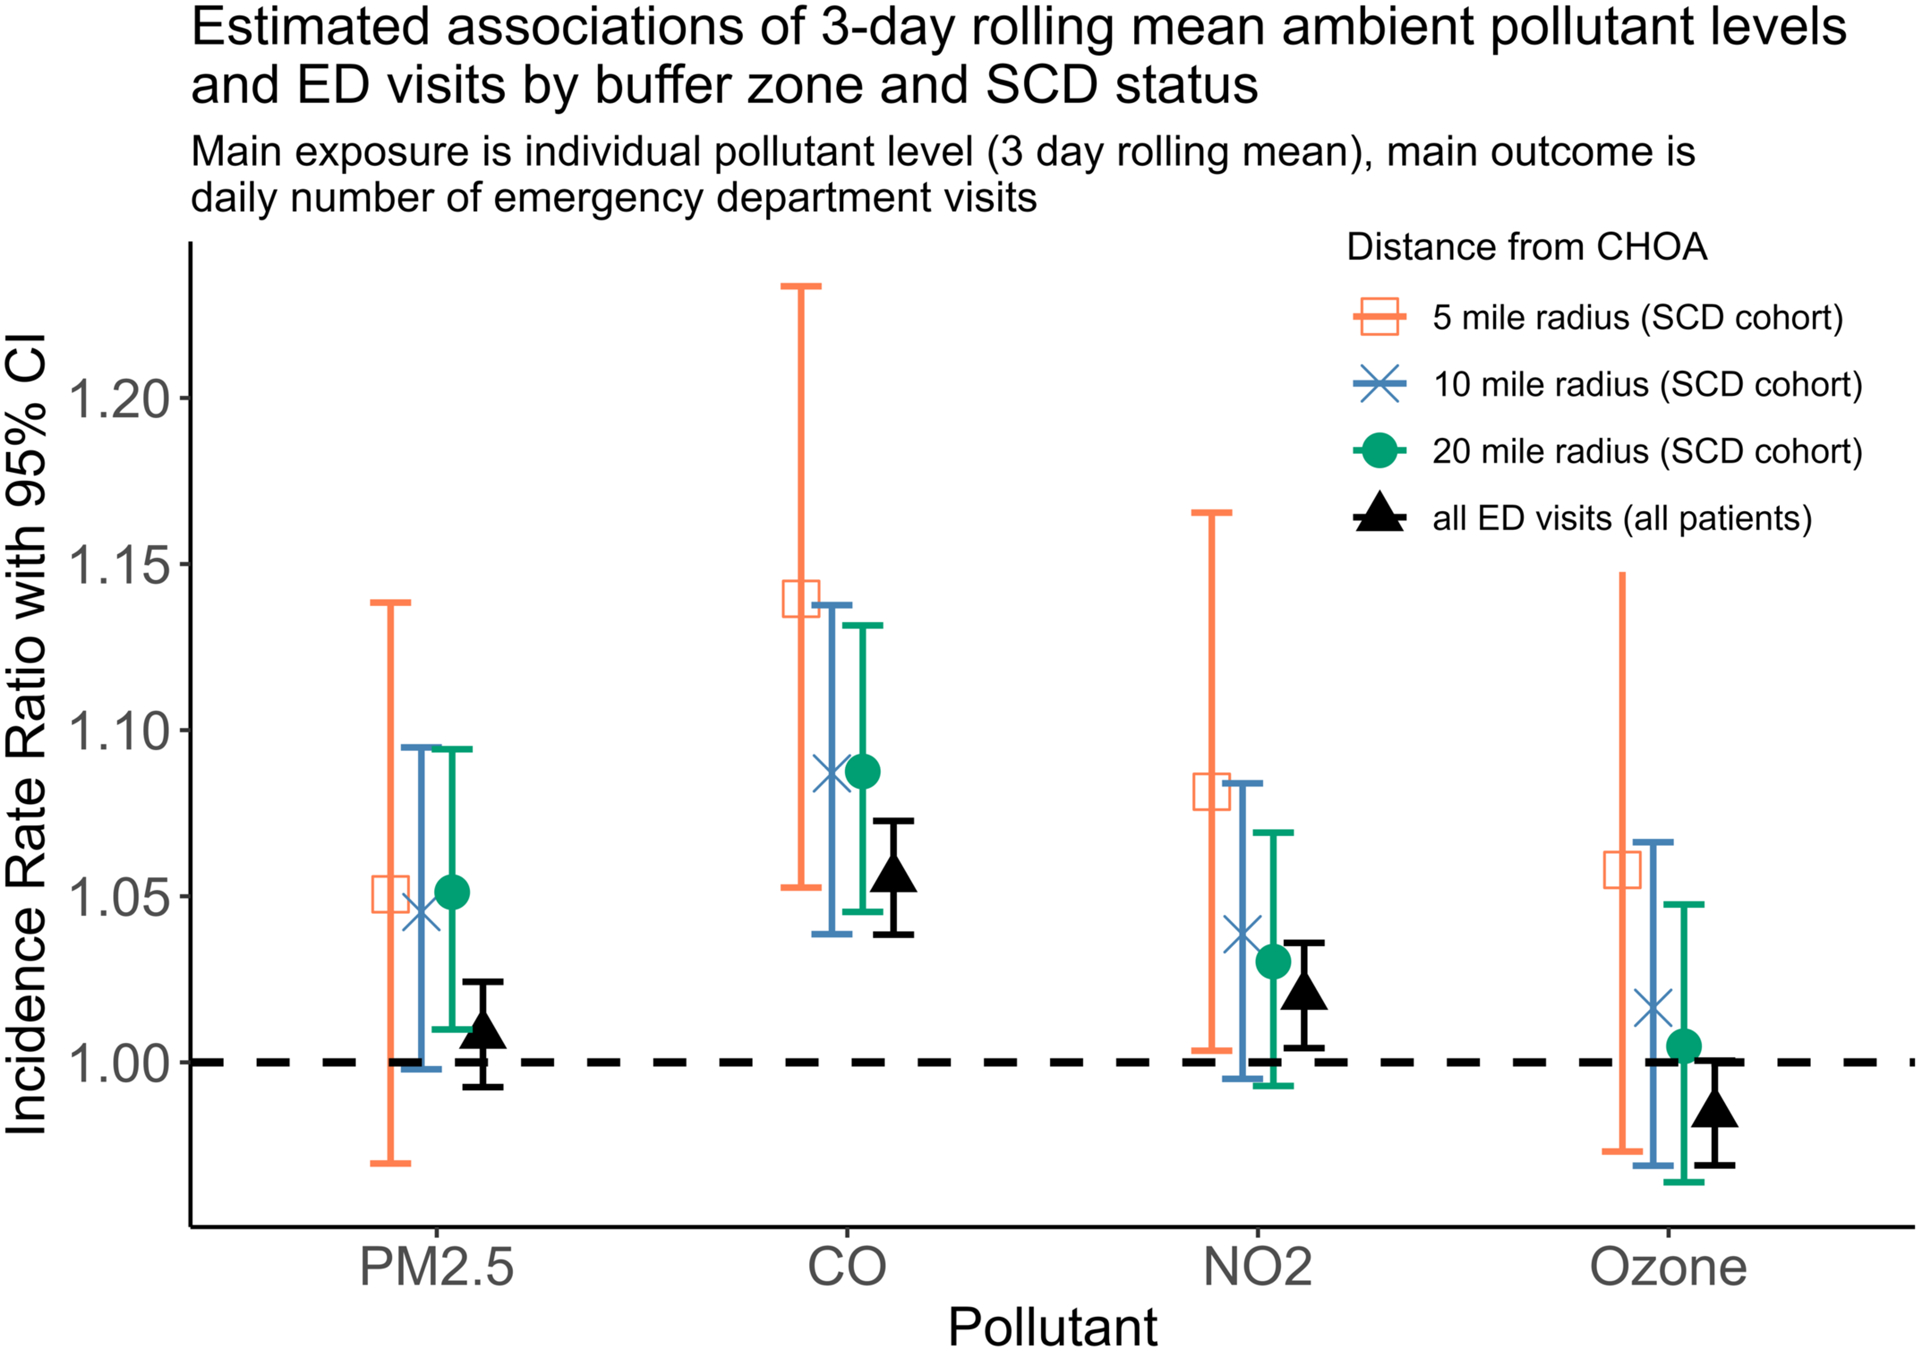
Figure 2: Estimated associations of 3-day rolling mean ambient pollutant levels and ED visits by buffer zone and SCD status.

Plot above shows results of 16 separate models (4 pollutants × 4 areas). Pollutant values are standardized (mean centered and divided by 2 times their standard deviation). Thus, PM2.5 20-mile radius incidence rate ratio of 1.051 can be interpreted as for every 2 standard deviation change in 3 day rolling mean PM2.5 levels, the daily number of emergency visits in this cohort increases by 5.1%. All ED visits (all patients) refers to all children 1.0–17.9 years who visited a CHOA emergency department (excluding only patients with SCD), included as comparison analysis. PM2.5 models include data from Jan 1, 2010 - Dec 31, 2016, all patient models from June 1, 2013 - Dec 31, 2018 (due to PM2.5 and all patient data restrictions), all other models from Jan 1, 2010 - Dec 31, 2018.
