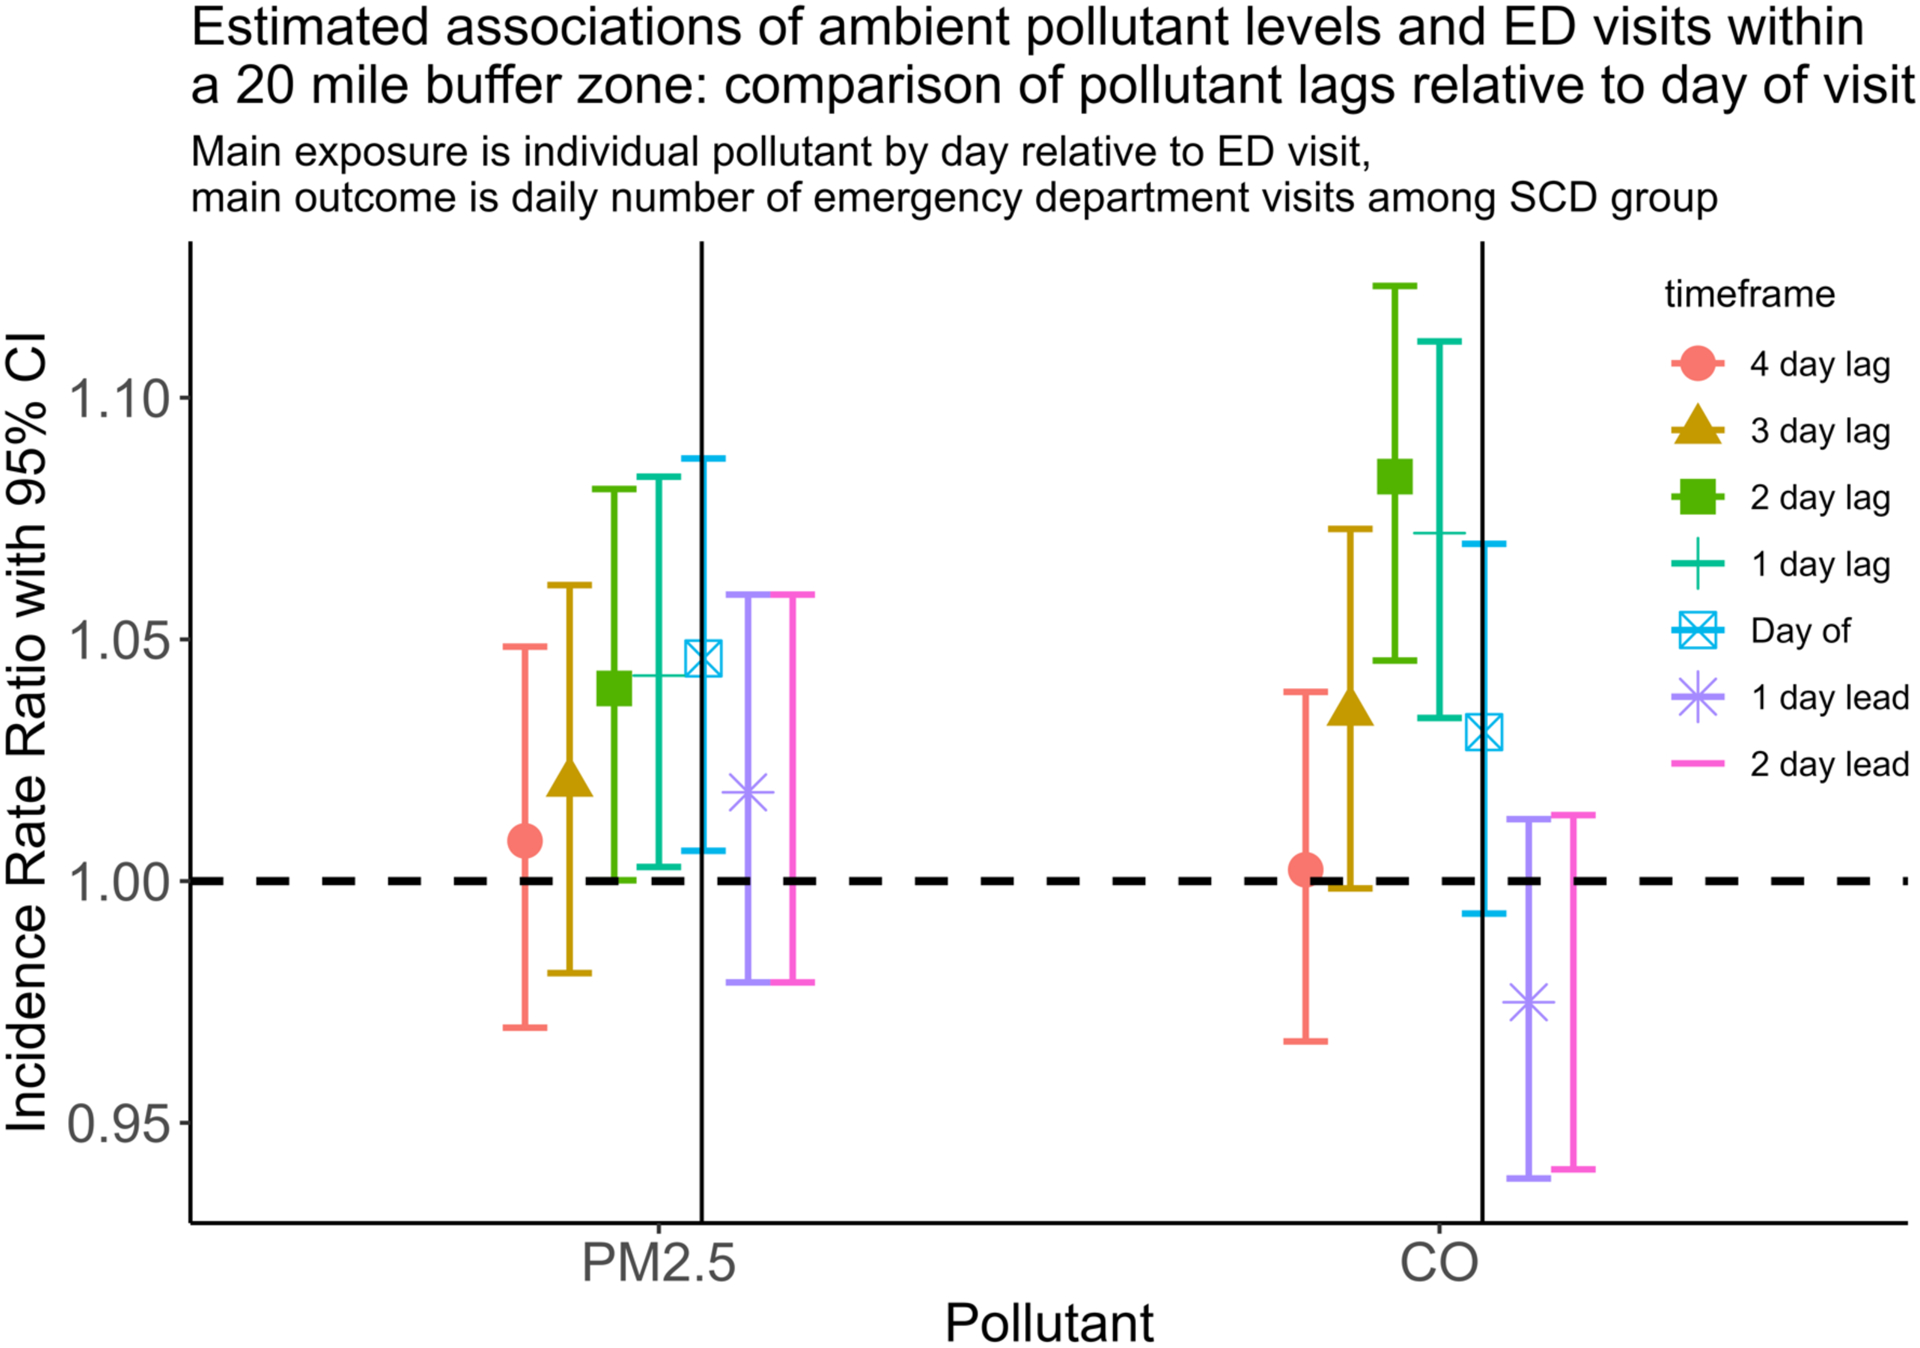
Figure 3: Estimated associations of ambient pollutant levels and ED visits within a 20-mile buffer zone: comparison of pollutant lags relative to day of visit.

Plot above shows the effect of PM2.5 and CO on daily emergency department visits for the SCD cohort. Lag day means day prior to encounter. For example, 2-day lag refers to the pollution levels 2 days prior to encounter. Solid vertical lines represent day of encounter.
