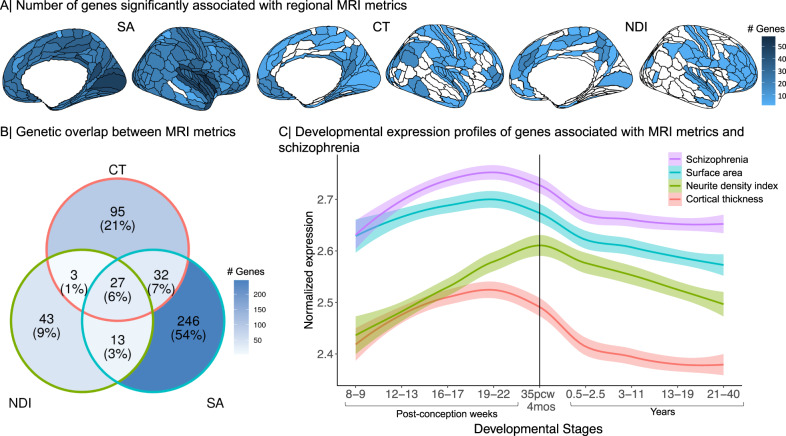
Fig. 1. Genetic associations with three MRI metrics of regional brain structure: surface area (SA), cortical thickness (CT) and neurite density index (NDI).
A Cortical surface maps representing the number of genes significantly associated with variation in each MRI metric at each of 180 cortical areas, from left to right: SA, CT, NDI. Regions without any significant gene associations are shown in white. B Venn diagram representing the number of genes that are specifically associated with each MRI metric or generically associated with two or three metrics. The percentages refer to the proportion of all genes associated with one or more MRI metrics represented in each segment of the Venn diagram. C Developmental trajectories of average gene expression from 8 post-conception weeks (PCW) to 40 years for the sets of genes significantly associated with each MRI metric or with schizophrenia (SCZ). The shaded region indicates 95% confidence intervals. The vertical line indicates the usual timing of birth. These results highlight mid-to-late fetal stages as a critical window for genetically controlled development of cortical regions2 and for expression of genes associated with risk of schizophrenia. Source data are provided as a Source Data file.

