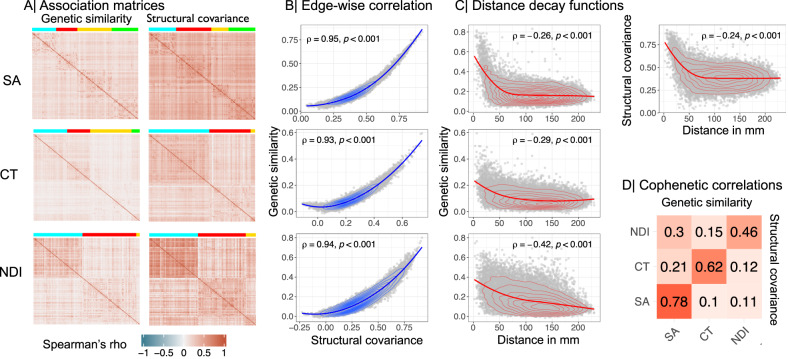
Fig. 3. Genetic similarity and structural covariance of cortical networks.
A Genetic similarity (left) and structural covariance (right) matrices for surface area (SA), cortical thickness (CT), and neurite density index (NDI). Brain regions are ordered according to modular decomposition of each matrix; see Fig. 4. B Edge-wise Spearman’s correlation between genetic similarity (y-axis) and structural covariance (x-axis) matrices. C Spearman’s correlation between genetic similarity (y-axis) and geodesic distance in millimetres (x-axis). For SA, the correlation between structural covariance and geodesic distance is also shown in the top right panel. For genetic similarity, the correlations with geodesic distance were: SA, ρ = −0.26; CT, ρ = −0.29; NDI, ρ = −0.42; all P ≤ 0.0001. Whereas, for structural covariance, the correlations with geodesic distance were: SA ρ = −0.24; CT ρ = −0.3; NDI ρ = −0.4; all P ≤ 0.0001. Spearman’s correlations were two-tailed. D Cophenetic correlation matrix showing the similarity in hierarchical clustering of structural covariance and genetic similarity matrices. The upper triangle shows cophenetic correlations based on genetic similarity, the lower triangle is based on structural covariance, and the diagonal represents the similarity between dendrograms of structural covariance and genetic similarity of the same MRI metric. These results indicate that the hierarchical clustering of structural covariance and genetic similarity networks is strongly coupled for each MRI metric, and quite specifically organised for each of the MRI metrics. Source data are provided as a Source Data file.

