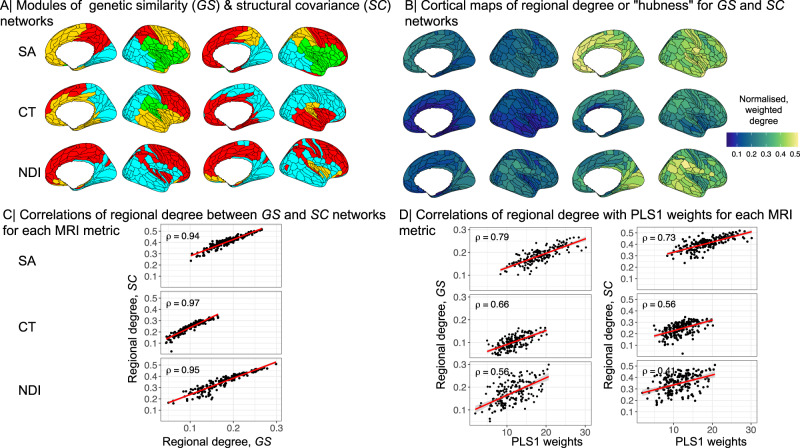
Fig. 4. Hubs of genetic similarity and structural covariance networks are co-located and associated with pleiotropic genes.
A Modular decomposition of genetic similarity matrices (left) and structural covariance matrices (right) for surface area (SA), cortical thickness (CT) and neurite density index (NDI). We used the Louvain algorithm to resolve the modular community structure of SC and GS networks for each MRI metric and found three (for NDI) or four (for CT, SA) spatially contiguous modules of the GS networks, and three (CT, NDI) or four (SA) modules of the corresponding SC networks (Methods). B Cortical surface maps of hub scores based on genetic similarity matrices (left) and structural covariance matrices (right). C Scatterplots showing positive Spearman’s correlations between hubness (weighted degree centrality) of nodes in genetic similarity (x-axis) and structural covariance networks (y-axis) for each MRI metric. D Scatterplots showing positive Spearman’s correlations between strength of pleiotropic gene association indexed by PLS1 weights (x-axis) and hub scores of nodes in genetic similarity networks (left) or structural covariance networks (right) (y-axis). The shaded region indicates 95% confidence intervals. Spearman’s correlations were two-tailed. Source data are provided as a Source Data file.

