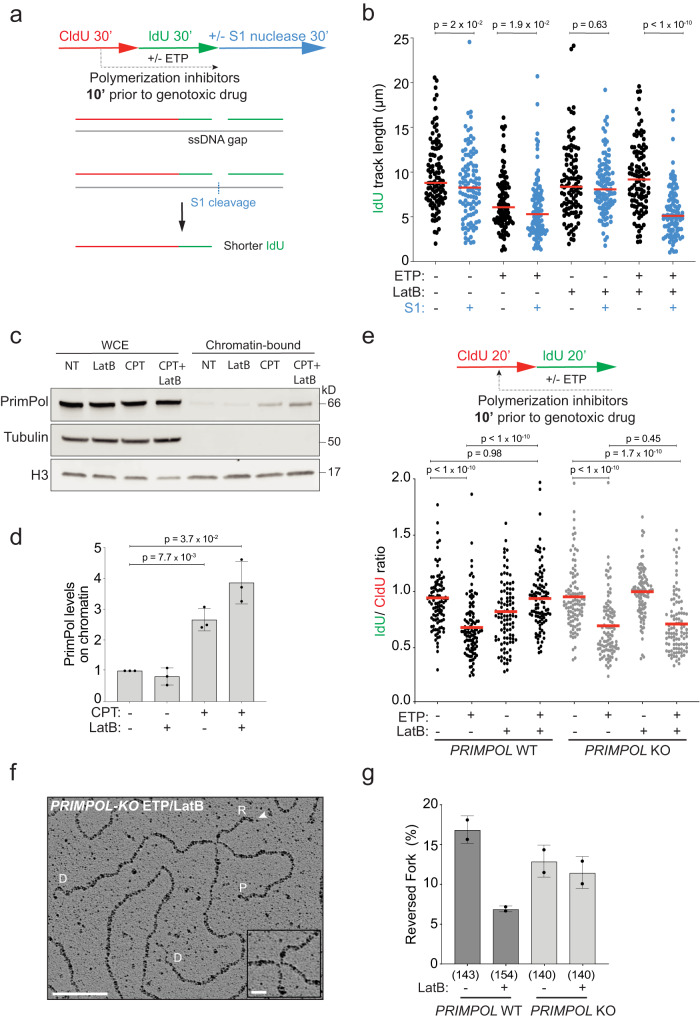
Fig. 5. PrimPol deregulation prevents efficient fork remodeling upon defective actin polymerization.
a Timeline of CldU/IdU pulse-labeling coupled with 30 min S1 nuclease treatment to detect ssDNA gaps on nascent DNA upon optional treatment with 20 nM ETP. 100 nM LatB was added 10 min prior to ETP and retained. b IdU track length (μm) is plotted as readout of discontinuous DNA synthesis for a minimum of 100 forks (black or blue dots) per sample in a single, representative experiment. Red lines indicate the median. See Supplementary Fig. 5d for compiled repetitions (n = 3). Statistical analysis: two-tailed Mann–Whitney test. c Representative immunoblot of the indicated proteins in whole cell extracts (WCE) or the chromatin bound fraction. d Bar graph depicts mean ± SD of chromatin bound PrimPol levels from three independent experiments from c (black dots). Values are normalized to H3 and represented as fold change over NT. Statistical analysis: one-tailed t-test with Welch’s correction. e DNA fiber analysis of U2OS PRIMPOL WT and KO cells. Top: CldU/IdU pulse-labeling protocol to evaluate fork progression upon 20 nM ETP. 100 nM LatB was added 10 min prior to ETP and retained during the IdU labelling. Bottom: IdU/CldU ratio plotted for a minimum of 100 forks per sample (black dots) from a single, representative experiment. Red line indicates median. See Supplementary Fig. 5e for compiled repetitions (n = 3). Statistical analysis: two-tailed Mann–Whitney test. f Representative electron micrograph of a reversed fork isolated from PRIMPOL KO cells, priorly treated with ETP and LatB; parental (P) and daughter (D) duplexes. White arrow indicates the regressed arm (R); the four-way junction at the reversed fork is magnified in the inset. Scale bar = 100 nm, 10 nm in the inset. g Frequency of reversed replication forks isolated from U2OS cells (proficient (WT) or deficient (KO) for PRIMPOL) upon 1 h of 20 nM ETP. 100 nM LatB was added where indicated 10 min before ETP and retained. Bar graph depicts mean ± SD from two independent EM experiments (black dots). Total number of molecules analyzed per condition in brackets. Source data are provided as a Source Data file.

