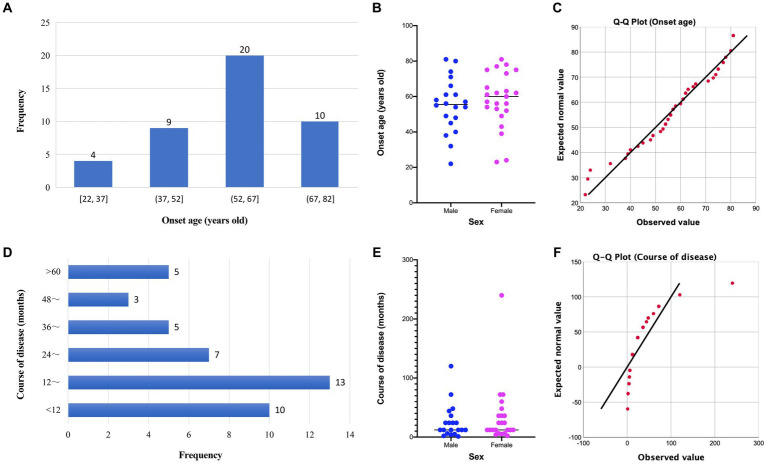
Figure 1.
Distribution and comparison of onset age and disease course of patients with Bowen’s disease. (A) Distribution of onset age of patients with Bowen’s disease; (B) comparison of onset age of patients with Bowen’s disease between males and females; (C) Q-Q plot of onset age; (D) distribution of disease course of patients with Bowen’s disease; (E) comparison of disease course of patients with Bowen’s disease between males and females; (F) Q-Q plot of disease course.

