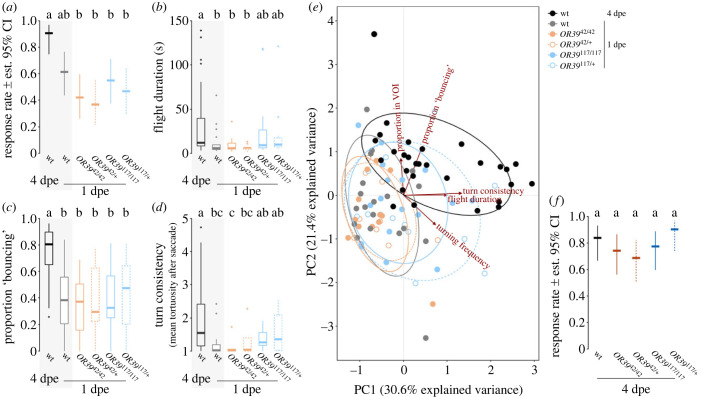
Figure 3.
Mosquito flight in OR39 knockout mosquitoes. (a) Response rate of mature (4 dpe) wild-type females, as well as teneral (1 dpe) wild-type and mutant females to the synthetic human blend and CO2 (experiment II). Different letters denote significant differences between the genotypes (pairwise comparison using ‘emmeans,’ corrected with the Tukey method). n(per treatment) = 30–32, p < 0.05. (b) Flight duration, (c) proportion of flight spent ‘bouncing’ at the upwind screen and (d) turn consistency (i.e. the mean tortuosity after a saccade). Please note that the data for the wild-type mosquitoes (grey boxes) is also shown in figure 1. Boxes represent upper and lower quartiles, whiskers denote 1.5 times interquartile distance, crosses outliers and thick horizontal lines the median. Different letters denote significant differences between the treatments (Dunn Kruskal–Wallis pairwise comparison test, Benjamini–Hochberg corrected). n(wt − 4 dpe) = 29, n(wt − 1 dpe) = 19, n(OR3942/42 − 1 dpe) = 12, n(OR3942/+ − 1 dpe) = 9, n(OR39117/117 − 1 dpe) = 17, n(OR39117/+ − 1 dpe) = 13. (e) Principal component analysis (PCA) of select flight parameters: proportion of flight within the VOI, proportion of flight ‘bouncing’ at the upwind screen, turn consistency, flight duration and saccade frequency. The PCA was optimized for maximal separation of the two wild-type groups. n = 9–29. (f) Response rate of mature wild-type and transgenic mosquitoes to the synthetic human blend and CO2 (experiment III). n(per genotype) = 31–32.

