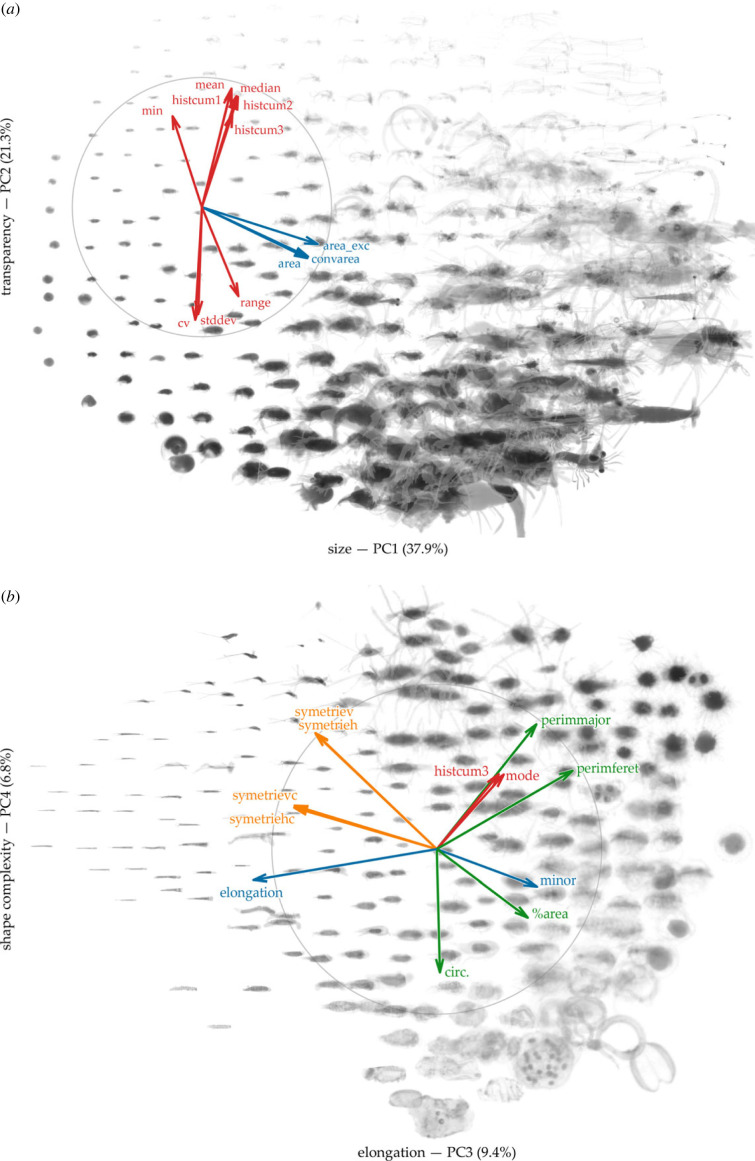
Figure 2.
Zooplankton morphological space defined by the first four PCA axes, computed from 45 variables measured on 845 812 individual images. For each plane, only the 12 most contributing features are drawn. Features are coloured according to the morphological facet they capture: red for shades of grey, blue for size, orange for symmetry and green for other aspects of the shape. The variance captured by each axis and its interpretation in terms of synthetic morphological trait are indicated in the axis label. Images representative of a region of the morphological space were synthesized by combining three images randomly selected in the neighbourhood and the result was drawn on the plot.

