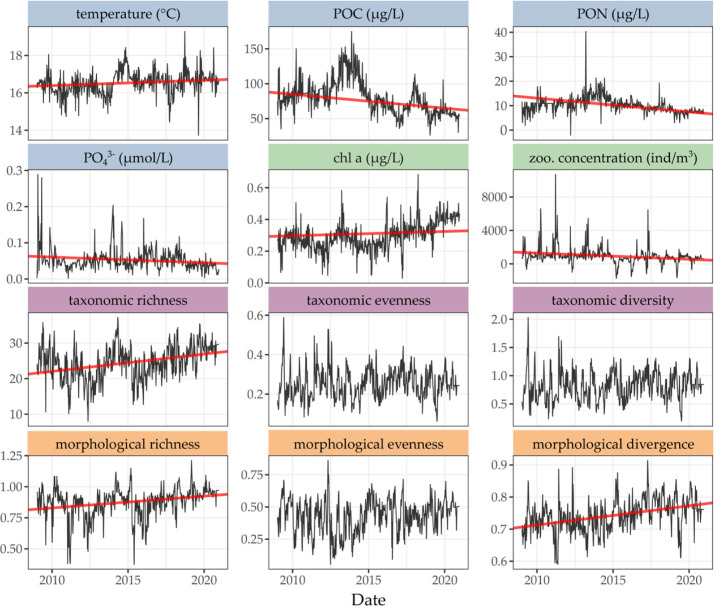
Figure 4.
Weekly time series of environmental variables (temperature, POC, PON, , chlorophyll a) and zooplankton concentration, taxonomic and morphological diversity indices (richness, evenness, diversity/divergence) over the years 2009–2020. Black lines are the de-seasonalized series, red lines are the significant trends (with p < 0.05) obtained from GLS regression.

