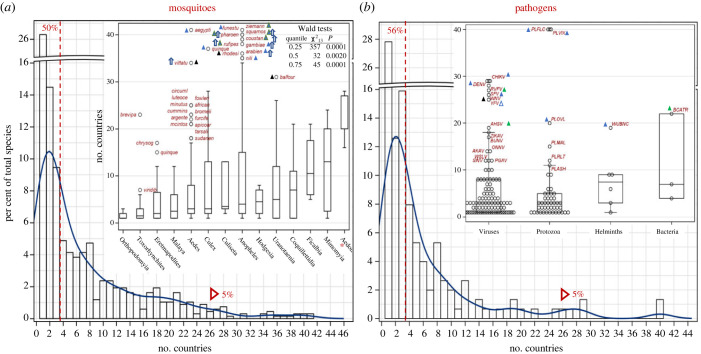
Figure 2.
Geographic range size of mosquitoes (a) and MBPs (b) based on the number of countries per species overall and by taxonomical groups (insets). Note the break in the y-axis. The fraction of species occupying 1–3 countries and over 25 countries are shown to the left of the red broken line and red triangle, respectively. Insets: number of countries per species across mosquito genera (a) and taxonomic group of MBPs (b). Genera represented by less than three species (Lutzia (N = 1), Mansonia (N = 2) and Aedeomyia (N = 2)) were pooled (red asterisk). The box shows the 25th, 50th and 75th quantiles of the distribution and the whiskers extend to the extreme observations up to 1.5× the interquartile range (75th–25th quantiles). Outliers exceeding the whiskers are shown by abbreviated species name (a) and acronym (b) in red; triangles indicate preference to blood feeding on (a) and transmission between (b) humans (blue) domestic animals (green) and wild hosts (black). Empty triangle (b) indicates transmission to humans but no persistent transmission from humans. Blue arrows indicate high-altitude windborne species (see text). Table (a) summarizes results of the quantile regression across quartiles (see text).

