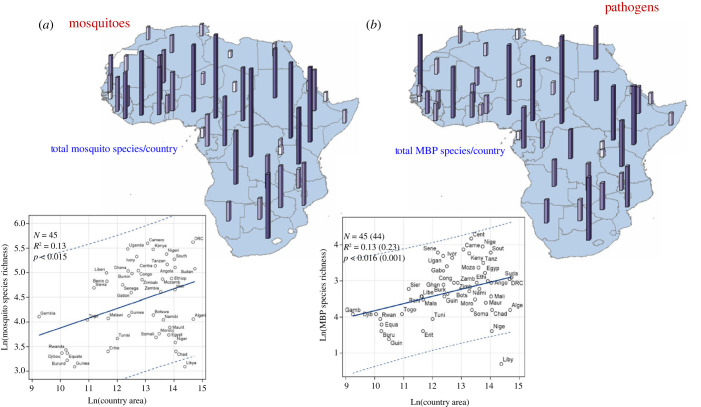
Figure 3.
Maps showing mosquito (a) and MBP (b) country diversity (top) and the country's area–species richness relationship (bottom). Bar height and colour shows total endemic species per country (top). Linear regression (solid line) shows the increase in expected number of species per country given its area with 95% confidence limit for individual countries (broken lines). Values in parenthesis (b) show the change in the regression's summary statistics after exclusion of outliers. Abbreviated country names are used. Note: countries with insufficient information are excluded (e.g. Eswatini), or pooled together (e.g. South and North Sudan) to reflect available information (Methods).

