Figure 2.
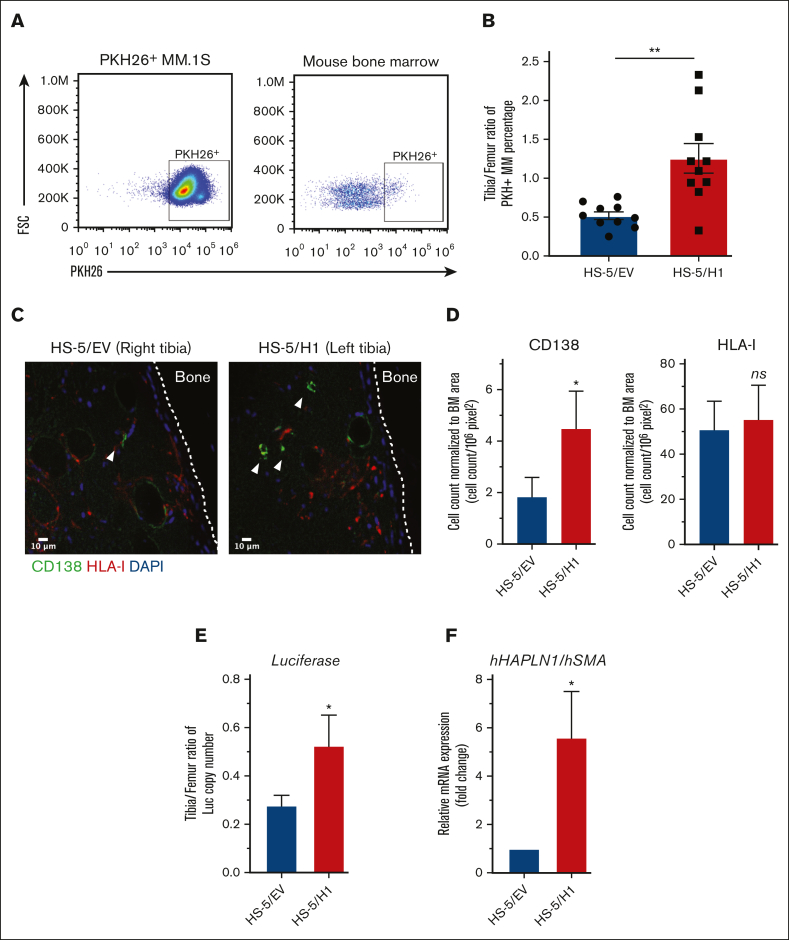
HAPLN1 matrikine induces MM cell BM homing in vivo. (A) Representative flow plots and gating strategy of PKH26+ MM.1S cells after cell culture (left) or from BM of mouse. (B) The percentage of PKH26+ MM cells in the tibia and femur of mice was obtained by flow cytometry, as in panel A, and the tibia/femur ratio of PKH26+ MM percentage was plotted. (C) Immunohistochemistry (IHC) images of tibia sections stained for MM cells (CD138, green color), HS-5 cells (HLA-I, red color) or nuclei (4′,6-diamidino-2-phenylindole [DAPI], blue color). The white dotted line indicates the outline of the cortical bone. The white arrowhead indicates CD138+ MM cells. (D) MM or HS-5 cells were counted in the imaged sections; their numbers were then normalized to the BM area from 2 to 4 sections of each tibia, averaged, and repeated for 5 mice. (E) Fifty ng of total genomic DNA collected from BM of individual mouse tibia and femur (n = 5) was used to quantify the luciferase copy number using quantitative polymerase chain reaction (qPCR) and luciferase gene standard, and the total copy number per tibia was calculated. The tibia-to-femur ratio of the luciferase copy number was plotted. (F) Total RNA was collected from above mouse tibia (n = 5) and human HAPLN1 mRNA was quantified using quantitative reverse transcription (qRT)-PCR and normalized to human SMA, and then fold changes were plotted using HS-5/EV–injected tibia set as 1. Data are expressed as means ± SEM. ∗P < .05; ∗∗P < .01; FSC, forward scatter.

