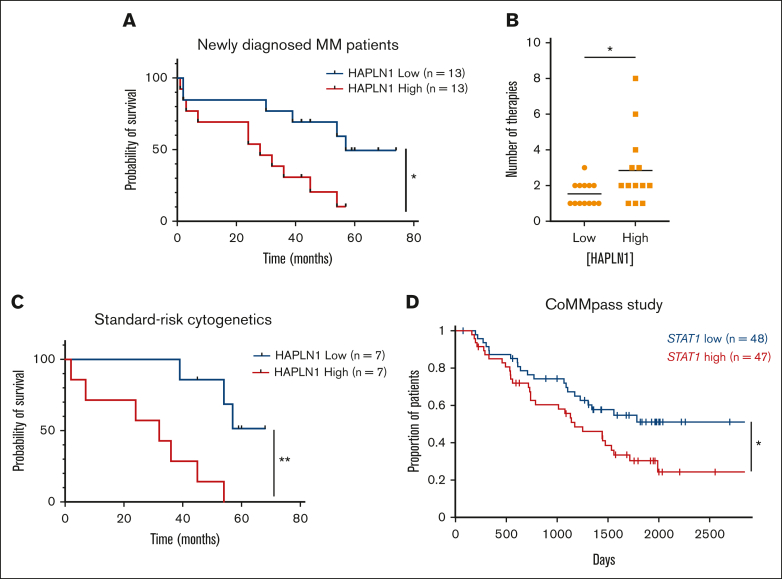
Figure 6.
High HAPLN1 levels in BM plasma fractions and high STAT1 mRNA levels in MM cells correlate with poor prognosis of patients with NDMM. (A) Kaplan-Meier PFS curve of the HAPLN1 high and low groups (n = 26). (B) Graph depicting the number of therapies that patients with NDMM received during the follow-up. (C) Kaplan-Meier PFS curve of patients at standard cytogenetic risk (n = 14). (D) Kaplan-Meier PFS curve of STAT1 high and low groups from the CoMMpass study. ∗P < .05; ∗∗P < .01.

