Figure 1.
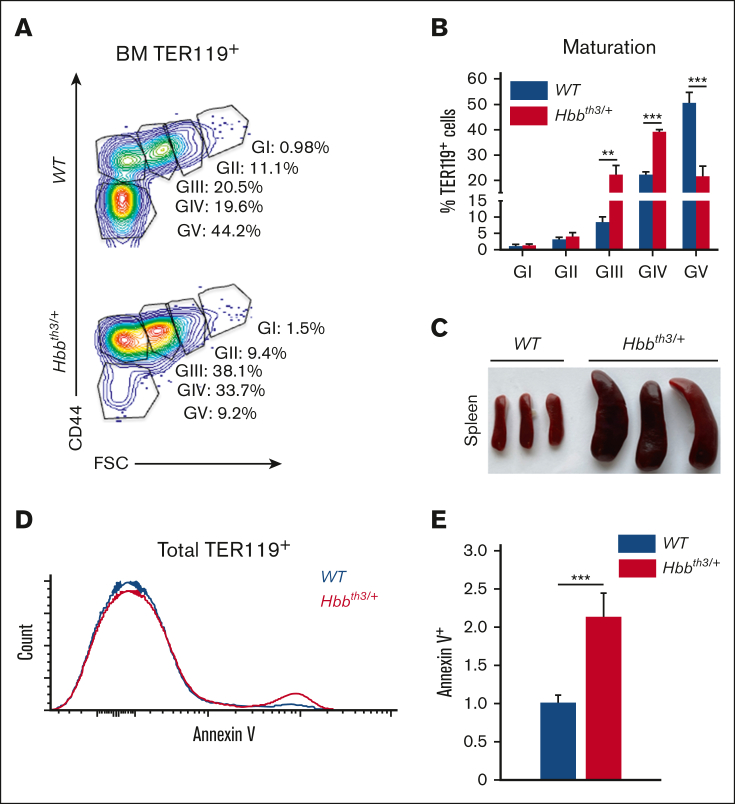
Erythroid apoptosis in β-thalassemia (Hbbth3/+) mice. (A) Gating strategy to identify pro-, basophilic, polychromatophilic erythroblasts (gate [G] I-GIII), orthochromatic erythroblasts and reticulocytes (GIV), and RBCs (GV) in WT and Hbbth3/+ bone marrow (BM) cells. (B) Graphs showing the percentage of each population in panel A. Note the increased gate III and IV with a concomitant decrease in gate V Hbbth3/+ erythroid cells. (C) Macroscopic appearance of the spleen in WT and Hbbth3/+ mice. (D) Overlay of FACS histogram of annexin V staining of WT vs Hbbth3/+ BM TER119+ subpopulations in live cells. (E) Fold change of annexin V+ in live TER119+Hbbth3/+ relative to WT cells (n ≥ 3). Results are shown as mean ± standard deviation (SD); ∗∗P < .01, ∗∗∗P < .001.

