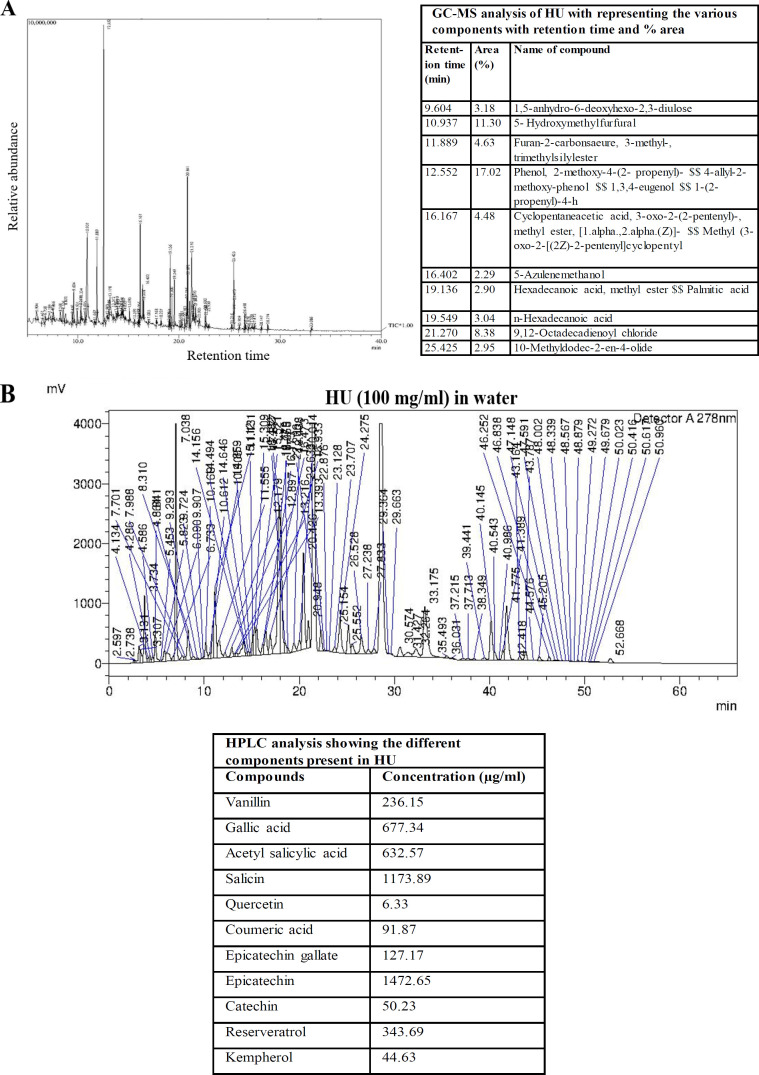
Figure 8.
Phytochemical Analysis of Methanolic Extract of HU by GC-MS and HPLC. GC-MS analysis of the methanolic extract of HU was performed. (A) GC-MS chromatogram (left panel) and the right panel representing the presence of various components with retention time and percent area are shown. Only the ten most abundant compounds are shown. (B) HPLC analysis of compounds present in methanolic extract of HU. HU extract was run through HPLC as described in the materials and methods. The presence of different components of HU was quantified by running standard compounds shown in the panel below the chromatogram

