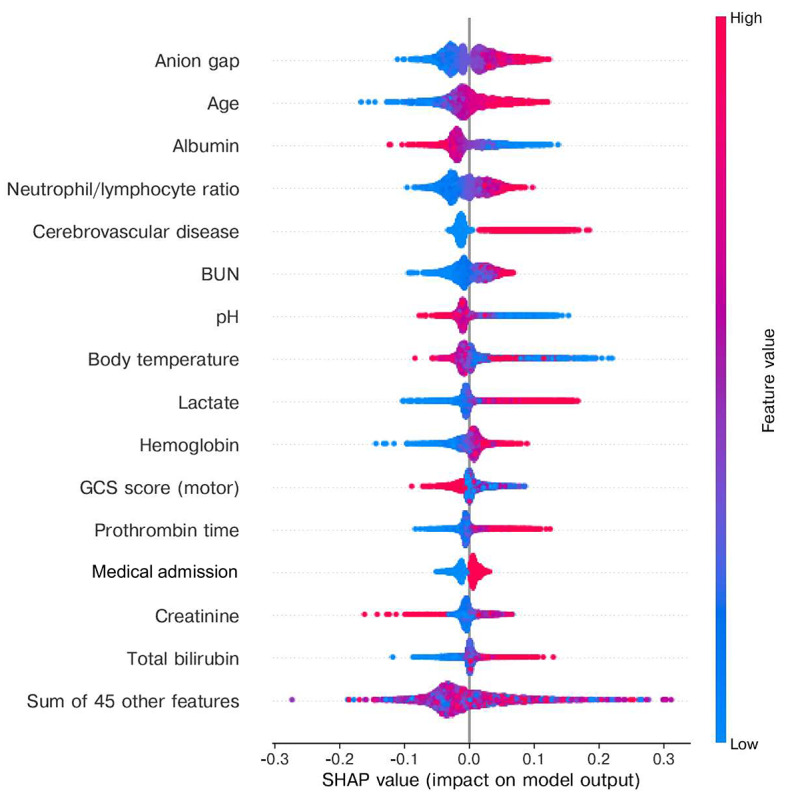
Figure 4.

The Beeswarm summary plot in the SHAP package with a randomly selected test set among a 5-fold cross-validation. This figure indicates which explanatory variables have the most significant influence on the model’s predicted value and the tendency of the model’s outcome probability as a function of the original value of an explanatory variable simultaneously. Each colored dot represents one variable value for a patient, for which larger values are presented in red and smaller values in blue. The SHAP value, a simplified and computer-friendly Shapley value, is shown on the horizontal axis and is a surrogate of the contribution of a variable value to the model output. BUN: blood urea nitrogen; GCS: Glasgow Coma Scale; SHAP: Shapley additive explanations.
