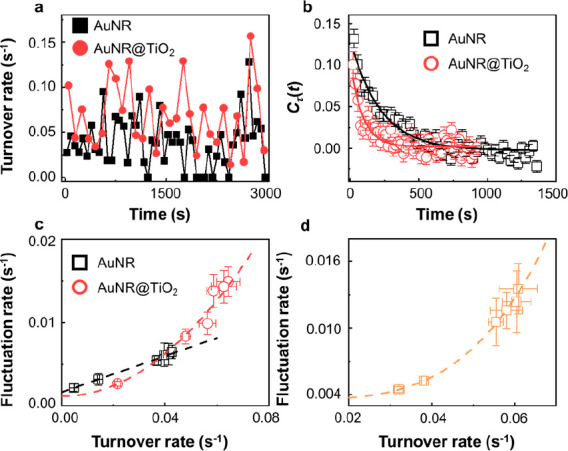
Figure 5.

(a) The time-dependent turnover rate for a single AuNR and AuNR@TiO2 nanozyme in catalyzing the AR oxidation. [AR] = 800 nM and [H2O2] = 60 mM. Turnover rates are calculated every 100 s. (b) Autocorrelation function Cτ(t) of the microscopic reaction time τ from the time sequence of AuNR (black square) and AuNR@TiO2 (red circle) catalysis. Each curve is an average of more than 60 nanozymes. The solid lines are fits with single exponential decay functions. The decay time constants are 220 ± 17 s (AuNR) and 89 ± 13 s (AuNR@TiO2), respectively. (c, d) Dependence of fluctuation rates on [AR] (c) and laser power (d). The y-axis is the inverse of the reactivity fluctuation correlation time obtained from Cτ(t). The superlinear curves are fits using y = y0 + kxγ, where γ is the photothermal factor.
