
Figure 2.
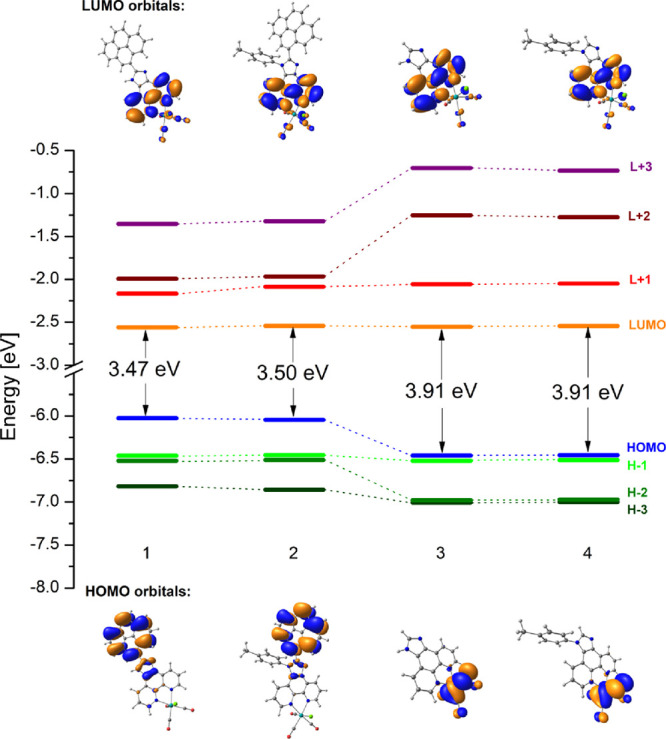
Partial molecular orbital energy level diagrams with the electron density plots of the highest occupied and lowest unoccupied MOs for complexes 1–4.
Official websites use .gov
A
.gov website belongs to an official
government organization in the United States.
Secure .gov websites use HTTPS
A lock (
) or https:// means you've safely
connected to the .gov website. Share sensitive
information only on official, secure websites.
Partial molecular orbital energy level diagrams with the electron density plots of the highest occupied and lowest unoccupied MOs for complexes 1–4.