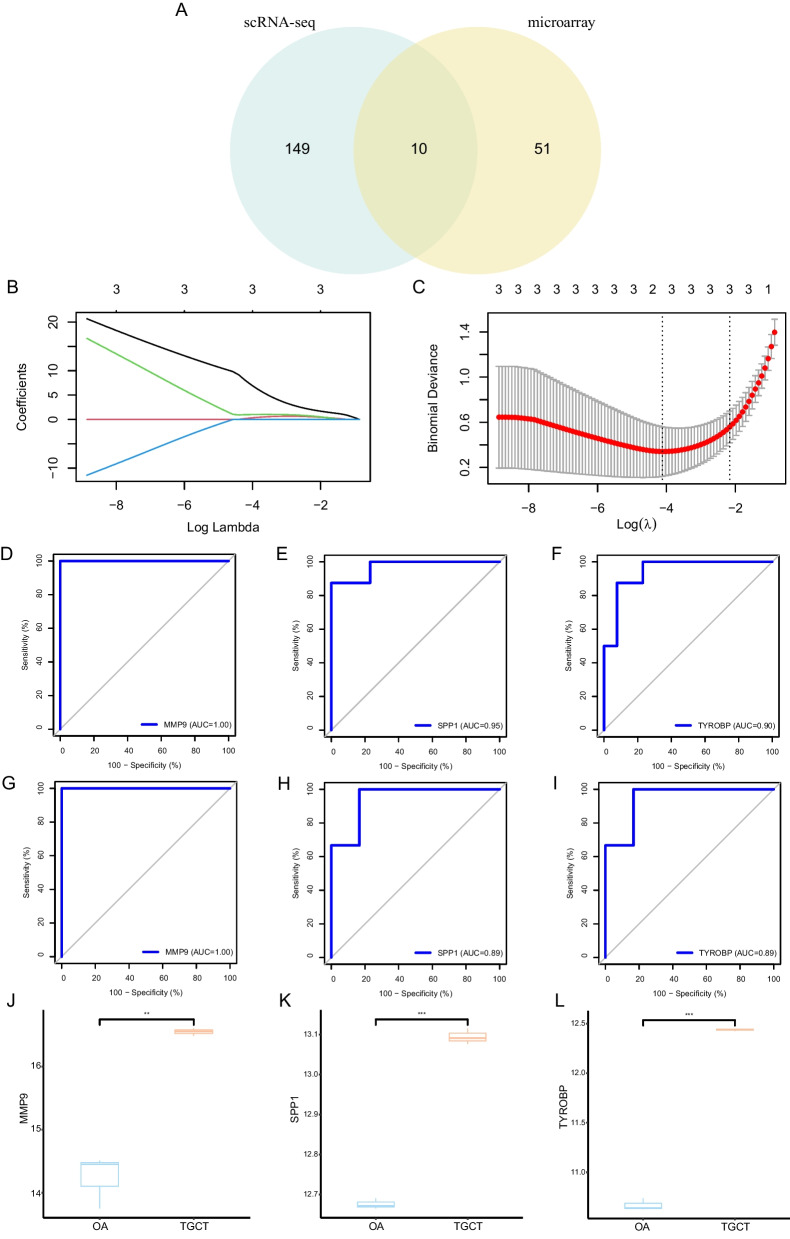
Fig. 4.
Identification and validation of OCSURGs. A Venn plot showing the intersection of up-regulated DEGs from microarray analysis and osteoclast marker genes from scRNA-seq. B, C LASSO algorithm retains three OCSURGs from 10 intersected genes. D, E, F The ROC curves of MMP9, SPP1, and TYROBP in the training dataset. G, H, I The ROC curves of MMP9, SPP1, and TYROBP in the testing dataset. J, K, L The expression level of MMP9, SPP1, and TYROBP in the GSE175626 dataset. *p-value < 0.05; **p-value < 0.01; ***p-value < 0.001; ns, not significant

