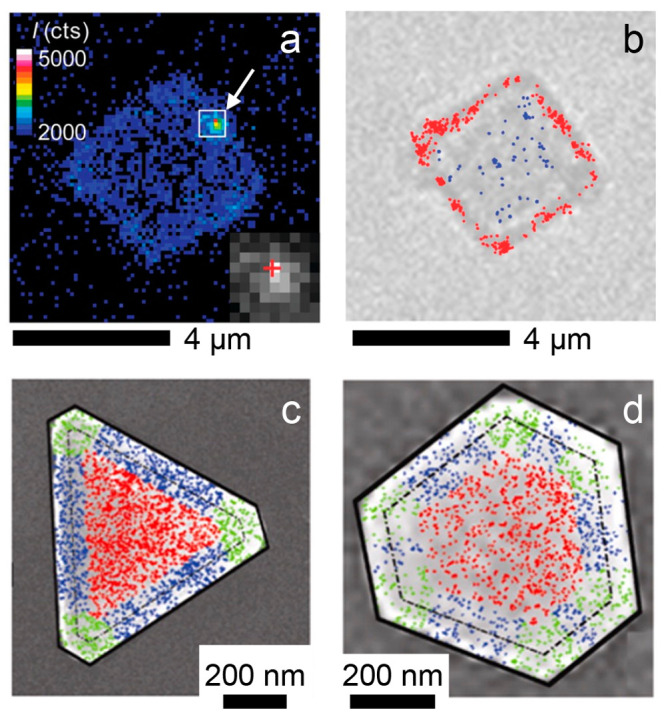
Figure 3.

Correlating SMF activity maps with optical and electron microscopy images. (a) Frame from SMF imaging showing a fluorescence burst (indicated by the white arrow) due to the photocatalytic reduction of DN-BODIPY on the surface of a TiO2 microcrystal. The color scale represents the fluorescence intensity counts. The inset shows an expanded view of the fluorescence burst, whose emission profile spreads over several pixels of the EM-CCD camera. (b) Optical transmission microscopy image of the same TiO2 microcrystal. The red dots indicate activated HN-BODIPY probes localized on the {101} facets around the perimeter of the microcrystal, while the blue dots indicate activated probe molecules localized on the basal {001} facet. The scale bars below each image are 4 μm. Panels (a) and (b) are adapted with permission from ref (87). Copyright 2011 American Chemical Society. (c) Activity map for the reduction of resazurin to resorufin on a triangular Au nanoplate overlaid on an SEM image of the same nanoplate. 2325 fluorescence bursts were localized to generate the activity map. The fluorescence bursts are color-coded to indicate different regions of the nanoplate with bursts from the flat {111} facet in red, bursts near the edges of the nanoplate in blue, and bursts near the corners in green. The dashed black line outlines the perimeter of the Au nanoplate, and the solid black line outlines the mesoporous silica shell coating the Au nanoplate. (d) Same as (c) but for a different hexagonal Au nanoplate with 1579 fluorescence bursts detected. The scale bars below each image are 200 nm. Panels (c) and (d) are adapted with permission from ref (80). Copyright 2013 American Chemical Society.
