Figure 5.
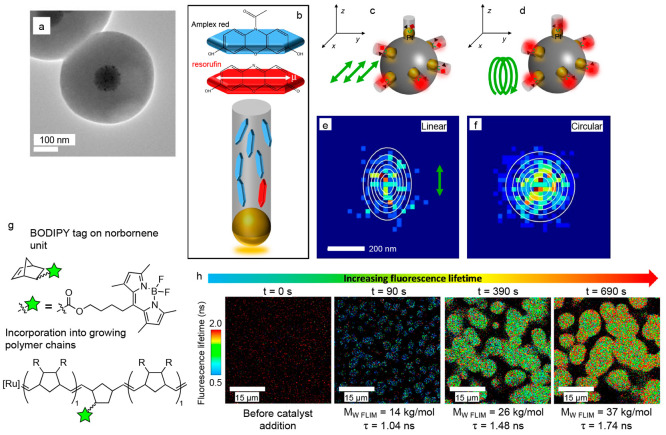
Measuring the polarization and lifetime of fluorophores in different microenvironments. (a) TEM image of a catalyst particle consisting of a solid SiO2 core decorated with Pt nanoparticles and then coated with a mesoporous SiO2 shell. (b) Schematic showing the preferred orientation of Amplex red (blue platelets) and resorufin (red platelet) within the tunnel-like pores of the mesoporous SiO2 shell. The white arrow indicates the dipole moment of a resorufin molecule. (c, d) Schematics showing the excitation of resorufin molecules (red squares) generated from the oxidation of Amplex red (black triangles) by Pt nanoparticles (gold spheres) on a SiO2 core (dark gray sphere) within the pores (light gray cylinders) of the mesoporous SiO2 shell. (c) Linearly polarized light will selectively excite resorufin molecules whose dipole moments align with the polarization direction (green arrows) of the incident laser excitation during SMF imaging. (d) Circularly polarized light (green spiral) will not lead to selective excitation. (e) Under linearly polarized light, an elliptical distribution of localizations was observed for resorufin molecules, indicating they are aligned within the tunnels of the mesoporous SiO2 shell. (f) Under circularly polarized light, a circular distribution of localizations was observed. Panels (a) through (f) are adapted from ref (71) under a Creative Commons license.223 (g) Schematic for the incorporation of a fluorescent BODIPY tag into either polynorbornene (R = H) or polydicyclopentadiene (R = polymer branches, cross-links, or the other half of the dicyclopentadiene monomer) through ring-opening metathesis polymerization using a third-generation ruthenium Grubbs catalyst. Approximately 1 in 107 monomer units incorporate the fluorescent label. (h) Fluorescence lifetime images during growth of polydicyclopentadiene particles before the Ru catalyst was added (left panel) and at different times after addition of the catalyst. The time after catalyst addition is given above each image. The molecular weight of the polymer determined by fluorescence lifetime imaging microscopy (MW FLIM), and the intensity-averaged fluorescence lifetime (τ) are given below each image. The fluorescence lifetime increases as the polymer particles grow. Panels (g) and (h) are adapted with permission from ref (203). Copyright 2022 American Chemical Society.

