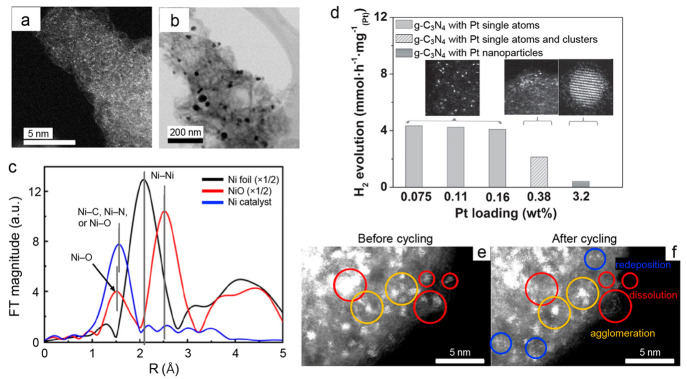
Figure 8.
Characterization of SACs. (a) STEM image of dispersed Ni atoms and (b) TEM image of Ni nanoparticles supported on g-C3N4 in different regions of the same sample. (c) FT-EXAFS spectra of a metallic nickel foil (black trace), nickel oxide (red trace) and the Ni/g-C3N4 catalyst sample shown in panels (a) and (b). The first peak in the Ni foil corresponds to the average Ni–Ni distance. The first peak in the NiO sample corresponds to the Ni–O distance, while the second peak corresponds to the Ni–Ni distance. The first peak in the Ni/g-C3N4 sample corresponds to Ni–C and Ni–N distances. Panels (a) through (c) are adapted from ref (263), with the permission of AIP publishing. (d) Comparison of photocatalytic activity for hydrogen evolution using different samples of Pt on g-C3N4 normalized per Pt atom. The insets show STEM images of representative samples containing either single Pt atoms, a mixture of single Pt atoms and clusters, or Pt nanoparticles as the loading of Pt on the g-C3N4 support increases. Panel (d) is adapted with permission from ref (251). Copyright John Wiley and Sons 2016. (e, f) STEM imaging of the same region of a Pt SAC on a carbon support (e) before and (f) after electrochemical cycling between 0.6 and 1.5 V vs the reversible hydrogen electrode in 0.1 M HClO4 for 1000 cycles. Panels (e) and (f) are adapted with permission from ref (262). Further permissions related to panels (e) and (f) should be directed to ACS.

