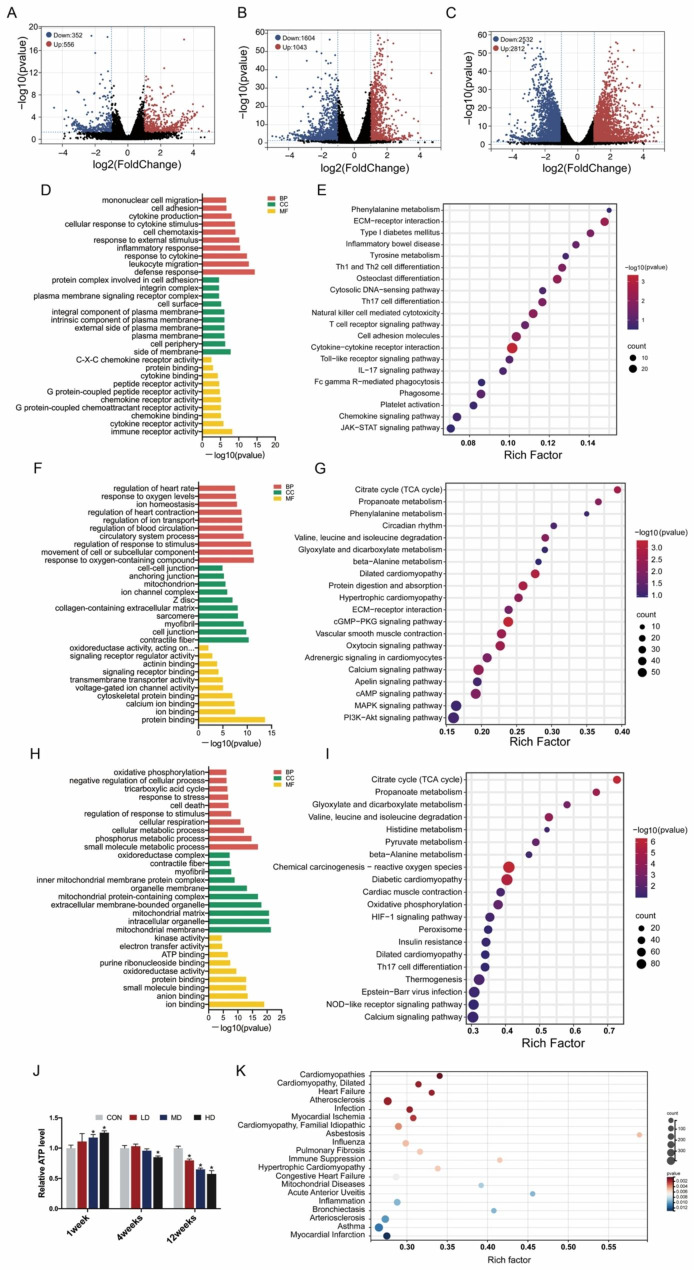
Fig. 6.
Transcriptome profiling of mouse heart tissues in response to PS-NPs after 1 week, 4 weeks and 12 weeks. Three mice in the HD groups and corresponding control groups were randomly selected for RNA-seq after PS-NPs treatment for 1 week, 4 weeks and 12 weeks. Volcano plots of DEGs were depicted by comparison between the CON and HD groups at 1 week (A), 4 weeks (B) and 12 weeks (C). GO terms and KEGG pathways were enriched based on the DEGs from the 1-week exposure group (D–E), 4-week exposure group (F–G) and 12-week exposure group (H–I). ATP content in heart tissues was evaluated after exposure for 1 week, 4 weeks and 12 weeks (J). The DEGs in the 12-week exposure group were selected to perform disease annotation analysis (K). Bar graphs indicate the mean ± SD. *P < 0.05

