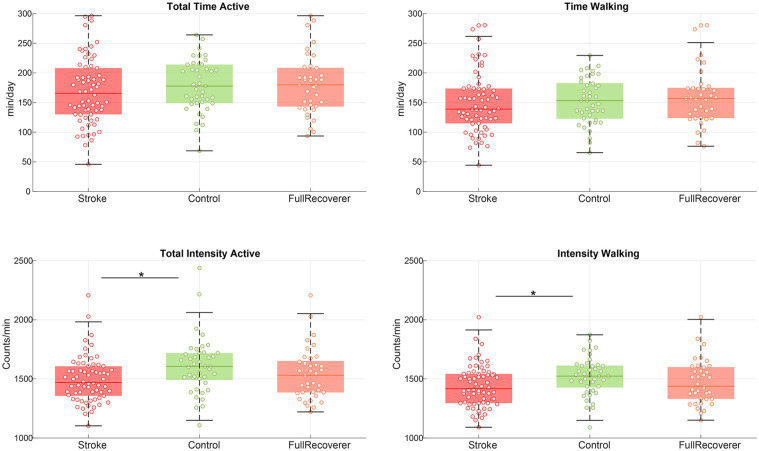
Figure 4.
Physical activity. Physical activity for mild stroke participants versus controls. The full recoverer subgroup included participants with a maximum score on the lower extremity scores of the Motricity Index and Fugl-Meyer assessment without coordination items. Individual datapoint are displayed with a circle, the colored line indicates the median and the surrounding box shows the interquartile range (IQR). The black error bars indicate the 25th percentile −1.5*IQR and 75th percentile −1.5*IQR, * = between group comparison showed a significant difference with a P < .05.

